
Figures & data
Figure 1. Identification and characterization of F-circBA1 in chronic myeloid leukemia. (a) Schematic representation of the position of the six divergent primer pairs on BCR-ABL. (b) PCR analysis of RNAs in leukemic cells harboring a BCR-ABL translocation (K562 and K562/G01) or other translocations (THP-1) for the identification of F-circBA1. Divergent primers were used to scout F-circBA1 and convergent primers are used to detect bcr-abl. RNAse R treatments were used to detect the stability of the product. (c) The sequence and reverse splicing site of F-circBA1 were verified via Sanger sequencing. (d) The expression levels of F-circBA1, BCR-ABL mRNA, U6 (Nuclear Control), and ACTIN (Cytoplasm Control) in the cytoplasm and nucleus of K562 and K562/G01 cells were analyzed using qRT-PCR. (e) F-circBA1 and BCR-ABL were amplified via PCR at RNA and gDNA levels with divergent and convergent primers, respectively. (f) The presence of F-circBA1 in patients with CML was detected via PCR
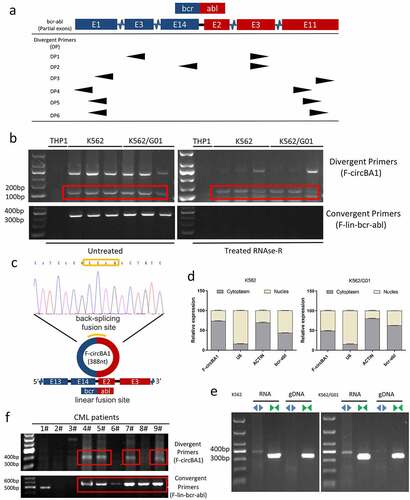
Figure 2. F-circBA1 plays an oncogenic role in CML cells in vitro. (a) Schematic representation of the junction site of F-circBA1 and two targeted siRNAs. (b) The expression levels of F-circBA1 and BCR-ABL in CML cells after lentivirus infection were analyzed using qRT-PCR. (c, d) The proliferation of CML cells after F-circBA1 knockdown was detected using CCK-8 and colony formation assays. (e) The cell cycle of BCR-ABL leukemia cells after F-circBA1 knockdown was detected using flow cytometry. *P < 0.05, **P < 0.01, ***P < 0.001
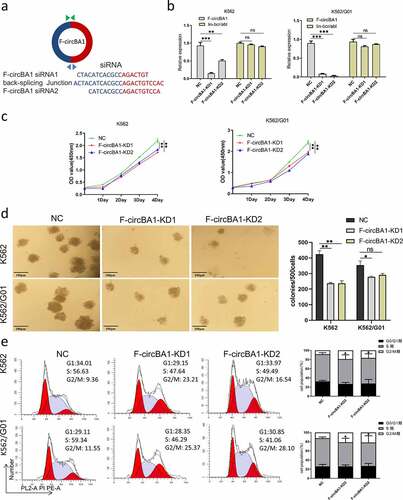
Figure 3. F-circBA1 promotes leukemogenesis in vivo. (a) Total white blood cell count of peripheral in PBS, NC, and F-circBA1-KD groups were determined. (b-d) The weight and size of liver and spleen in PBS, NC, and F-circBA1-KD groups were determined. (e) The infiltration of CML cells in the indicated organs of each group was detected via histopathological and bone marrow cytological analysis. (f) The percentage of GFP+ cells in the peripheral blood of each group were tested using flow cytometry. (g) Survival curves were analyzed using Kaplan-Meier methods. *P < 0.05, **P < 0.01, ***P < 0.001
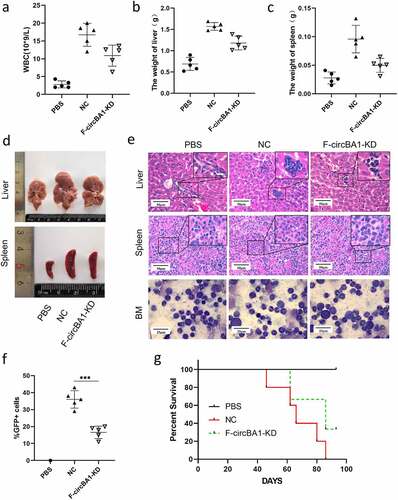
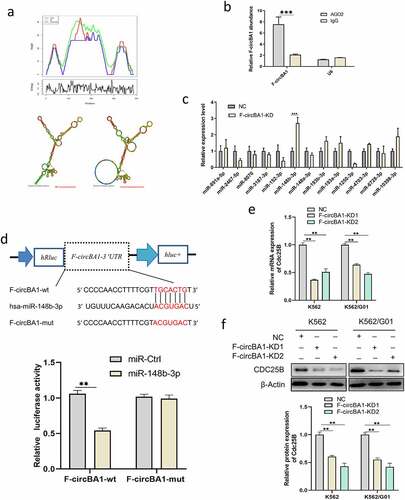
Figure 4. F-circBA1 acts as an miR-148b-3p sponge and has clinical significance. (a) Schematic representation of the secondary structure of F-cirBA1. (b) The binding ability of F-circBA1 and AGO2 was detected via AGO2 RIP and qRT-PCR analysis. (c) The expression level of the target miRNA of F-circBA1 after F-circBA1 knockdown in CML cells was detected via qRT-PCR. (d) The binding ability of F-circBA1 and miR-148b-3p was determined via luciferase assay. (e, f) The mRNA and protein expression levels of CDC25B in CML cells after F-circBA1 knockdown were detected using qRT-PCR and WB. *P < 0.05, **P < 0.01, ***P < 0.001
Supplemental Material
Download ()Data availability statement
The data used to support the findings of this study are available from the corresponding author upon request.