
Figures & data
Table 1. Primer sequences used for qRT-PCR in our study
Figure 1. INHBA overexpression is associated with a poor survival rate in BC. (a) Upregulation of INHBA in BC tissue from TCGA database. (b) Upregulation of INHBA in two sub-types of BC as compared to normal tissues, using Oncomine database. (c) INHBA overexpression in BC patients with lymph node metastasis (N stage indicates the level of lymph node metastasis; the higher the number, the more metastasis in lymph node). Data were retrieved from TCGA database. (d) INHBA overexpression is correlated with a worse prognosis in BC patients (TCGA database). (e) BC data from Human Protein Atlas database was used analyze the correlation between the protein level of INHBA and the prognosis of BC patients (P = 0.0041)
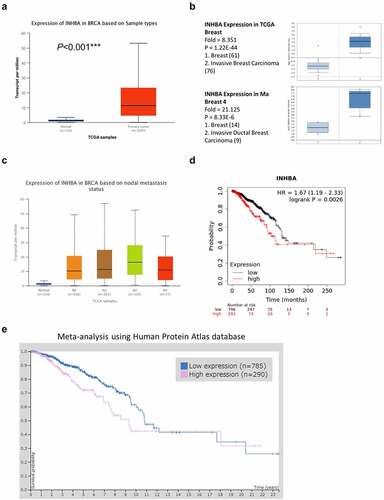
Figure 2. The INHBA is upregulated in BC cells and facilitates cell growth. (a) The INHBA overexpression in four BC cell lines was measured by RT-qPCR and Western blot. β-actin was used as the loading control. (b) The efficiency of INHBA knockdown in BT549 cells by sh-INHBA#1/2 or sh-NC vectors was assessed by RT-qPCR and Western blot. GAPDH was used as a loading control in Western blot. (c) CCK-8 assay and (d) colony formation assay were performed to examine the cell proliferation of BT549 cells after the transfection of shRNA. (e) The migration of transfected cells was examined by wound healing assay. (f) The invasion ability of transfected cells was determined by transwell assays (×200 magnification). Data are summary of 3 independent experiments (n = 3). The error bars are defined as s.d. *, P < 0.05, **, P < 0.01, and ***, P < 0.001
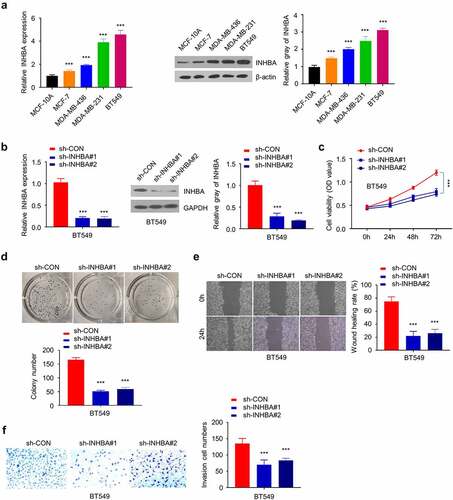
Figure 3. The overexpression of INHBA enhances BC cells migration and invasion. (a) The efficiency of INHBA overexpression in MCF-7 cells transfected by human INHBA cDNA or empty vectors were assessed by RT-qPCR and Western blot. GAPDH was used as a loading control in Western blot. (b) CCK-8 assay and (c) colony formation assay were performed to examine the cell proliferation of MCF-7 cells after the transfection of cDNA. (d) The migration of transfected cells was examined by wound healing assays. (e) The invasion of transfected cells was determined by transwell assays (×200 magnification). Data are summary of 3 independent experiments (n = 3). The error bars are defined as s.d. *, P < 0.05, **, P < 0.01, and ***, P < 0.001
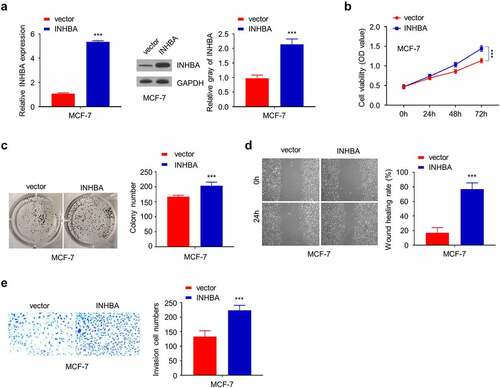
Figure 4. The overexpression of INHBA enhances the aggressiveness in MCF-10A cells. (a) The efficiency of INHBA overexpression in MCF-10A cells transfected by human INHBA cDNA or empty vectors were assessed by RT-qPCR and Western blot. GAPDH was used as a loading control in Western blot. (b) CCK-8 assay and (c) colony formation assay were performed to examine the cell proliferation of MCF-10A cells after INHBA overexpression. (d) The migration of transfected cells was examined by wound healing assays. (e) The invasion of transfected cells was determined by transwell assays (×200 magnification). Data are summary of 3 independent experiments (n = 3). The error bars are defined as s.d. *, P < 0.05, **, P < 0.01, and ***, P < 0.001
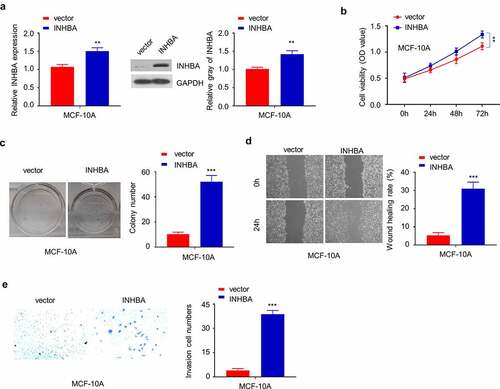
Figure 5. INHBA induces the EMT in BC cells. (a) Western blot analysis of the EMT-related proteins after knockdown of INHBA in BT549 cells (left) and overexpression in MCF-7 cells (right). (b) RT-qPCR analysis of the EMT-related genes after knockdown of INHBA in BT549 cells (left) and overexpression in MCF-7 cells (right). GAPDH was used as a loading control in Western blot. Data are summary of 3 independent experiments (n = 3). The error bars are defined as s.d. *, P < 0.05, **, P < 0.01, and ***, P < 0.001
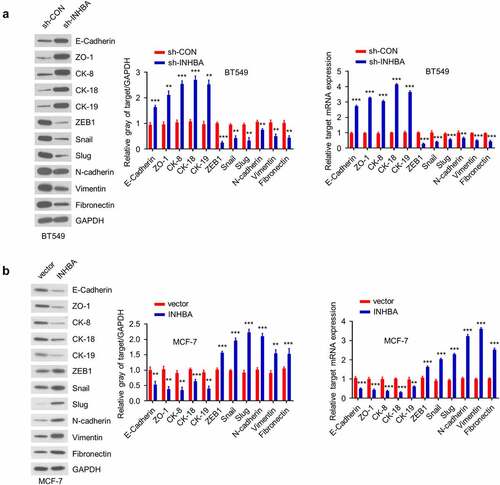
Figure 6. INHBA expression is positively correlated with TGF-β1, Smad2, Smad7, Snail and Slug, and negatively correlated with CK-19 in BC tissues. Pearson correlation analysis between INHBA expression and several TGF-β and EMT related genes using a web-based predictive tool ENCORI (http://starbase.sysu.edu.cn)
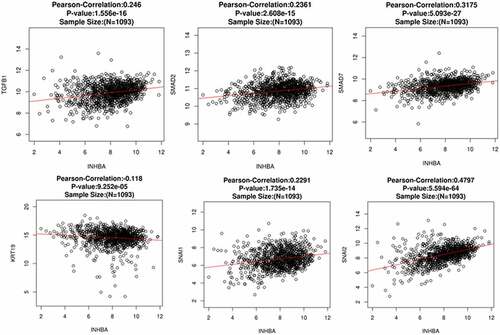
Figure 7. INHBA overexpression activates the TGF-β signaling pathway, which is suppressed by TGF-β inhibitor. (a) The protein level of TGF-β1, Smad2, p-Smad2, Smad3, p-Smad3 and VEGF-A in BT549 (INHBA knockdown) and MCF-7 cells (INHBA overexpression). GAPDH was used as loading control in Western blot. (b) The protein level of Smad2, p-Smad2, Smad3, p-Smad3, TGF-β1, INHBA in MCT-7 cells treated by TGF-β inhibitor (SB-431,542). 10 µM SB-431,542 was used as final concentration in the medium. DMSO solvent was also used as a negative control. (c) The cell migration (upper two) and invasion (lower two) analyses for MCF-7 cells treated with (or without) TGF-β inhibitor (×200 magnification). (d) Western blot analysis of EMT-related genes in MCF-7 cells transfected with (or without) INHBA expression vector, along with (or without) SB-431,542. Data are summary of 3 independent experiments (n = 3). The error bars are defined as s.d. *, P < 0.05, **, P < 0.01, and ***, P < 0.001
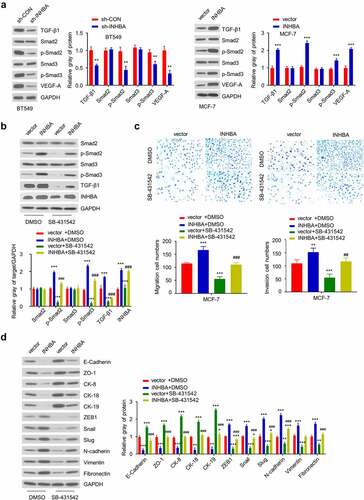
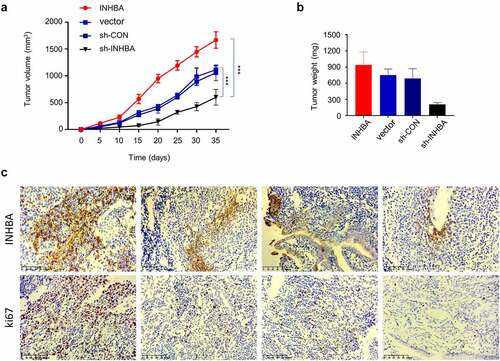
Figure 8. In vivo tumorigenesis assay corroborates the oncogenic role of INHBA in BC cells. (a-b) MCF-7 cells transfected with empty vector, INHBA cDNA, sh-INHBA, or sh-NC was injected into RAG1-deficient mice (n = 6 mice in each group). The tumor volume and weight were measured for 7 weeks after tumor cell injection. (c) IHC staining of Ki-67 (cell proliferation marker) and INHBA in the tumor tissues of different experimental groups
Availability of data and materials
The datasets used and/or analyzed during the current study are available from the corresponding author on reasonable request.