
Figures & data
Table 1. Patients demographics and clinical characteristics
Figure 1. α Diversity analysis A, B, C for Sobs, Shannon, and ACE indices of UC patients and healthy control subjects at the OTU level. D, E, F for Significant differences between samples from 2 selected groups. *P < 0.05, **P < 0.01, ***P < 0.001. X and Y axes show group names and exponential averages for each group, respectively
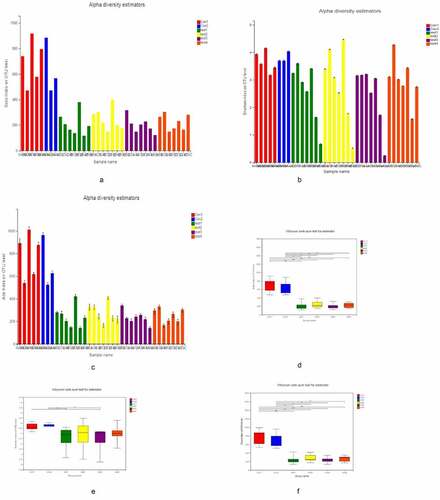
Figure 2. Microbiota composition,A, B, C represent the Venn diagram with different colors representing different groups (or samples); numbers in overlapping areas represent the number of species common to multiple groups, and numbers in nonoverlapping areas represent the number of unique species in corresponding groups. D, the X and Y axes show sample or group names and species names, respectively. The abundances of different species in the samples are represented by a color gradient; values represented by the color are shown to the right. E, F represent the Circos diagram of the relationship between sample and species
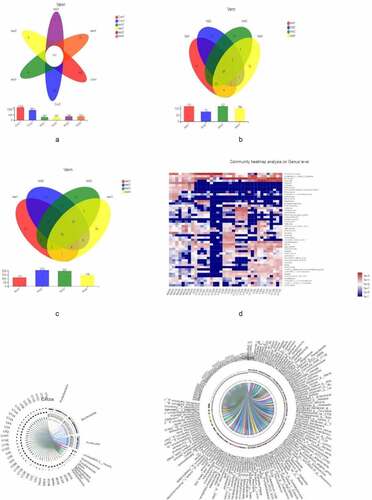
Figure 3. β diversity analysis, A, different colors represent sample groupings, and the box chart in the figure represents the dispersion of different groups of samples on the PC1 axis. B, X and Y axes show 2 selected spindles, and the percentages are the interpreted value of the axes for differences in sample composition. The scales of the X and Y axes are relative distances that have no practical significance. Different colors or shapes represent different groupings of samples; a shorter distance between 2 sample points indicates greater similarity in their species composition. C, different color nodes represent microbiota that is significantly enriched in the corresponding group and have a significant effect on intergroup differences; pale yellow nodes represent microbiota that are not significantly different across groups or that have no significant effect on intergroup differences
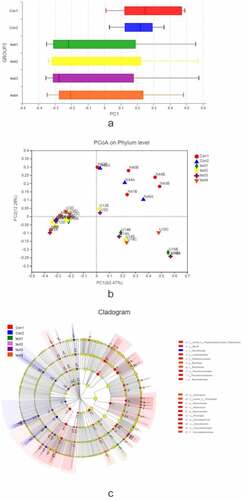
Figure 3. Continued
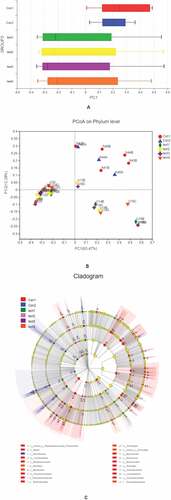
Figure 4. Relationship between species composition and lesion severity. Compared to normal control samples, UC patients showed reduced microbiota diversity and abundance in the colon irrespective of lesion severity, with significant differences observed at the phylum level (Actinobacteriota, Chloroflex, and Patescibacteria) and genus level (Ralstonia and Rhodococcus, which were less abundant in UC patients) (a, b). Lowerdiversity and abundance of microbiota was also observed in the small intestine of UC patients, with significant differences for Acidobacteria, Planctomycetota, and other phyla (c, d). Among UC samples, there were differences between relatively normal tissue and lesions at the phylum (e.g., Actinobacteriota, and Chloroflexi) and genus (eg, Ralstonia, Rhodococcus, Burkholderia-Caballeronia-Paraburkholderia) levels (e, f). Thus, differences in intestinal mucosa microbiome profiles at the phylum and genus levels in UC patients were independent of lesion severity (g, h)
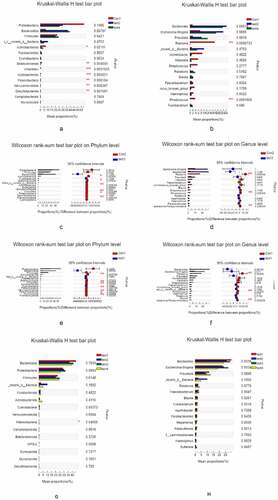
Table 2. Optical density values for serum GLP-2 detected by ELISA in ulcerative colitis patients and healthy control subjects
Table 3. Results of the independent samples test for optical density value of serum GLP-2 in ulcerative colitis patients and healthy control subjects
Table 4. The expression of Glp-2 in colonic mucosa group number (-) (+) (++) (+++) UC 11 4 3 3 1 Normal 9 0 2 4 3
Figure 5. Immunohistochemical detection of GLP-2 expression in the intestinal mucosa. A, strong positive expression of GLP-2 (+++) (most healthy control samples). B, weak positive expression of GLP-2 (+). C, negative expression of LP-2 (−) (most UC samples), D, diagnosed UC sample histology H&E staining
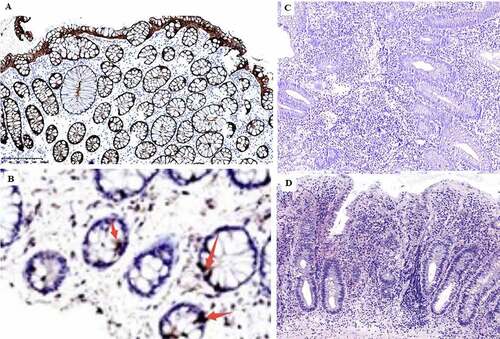
Figure 6. [α diversity]. a X and Y axes show clinical parameters and bacterial species present in the intestinal mucosa, respectively. *P < 0.05, **P < 0.01, ***P < 0.001. b–f X and Y axes show clinical parameters and β – or α-diversity index, respectively. The X-coordinates represent environmental factors (e.g., pH, temperature, etc.), the Y-coordinates represent the rank of β-diversity or the α-diversity index, R2 is a determining factor, representing the proportion of variation interpreted by the linear regression line, and the greater R2 index, the higher the degree of interpretation of this environmental factor is on the differences in the composition of the group or in the α-diversity index. b C-reactive protein. c Erythrocyte sedimentation rate. d Thrombocyte count. e GLP-2. f OGTT
![Figure 6. [α diversity]. a X and Y axes show clinical parameters and bacterial species present in the intestinal mucosa, respectively. *P < 0.05, **P < 0.01, ***P < 0.001. b–f X and Y axes show clinical parameters and β – or α-diversity index, respectively. The X-coordinates represent environmental factors (e.g., pH, temperature, etc.), the Y-coordinates represent the rank of β-diversity or the α-diversity index, R2 is a determining factor, representing the proportion of variation interpreted by the linear regression line, and the greater R2 index, the higher the degree of interpretation of this environmental factor is on the differences in the composition of the group or in the α-diversity index. b C-reactive protein. c Erythrocyte sedimentation rate. d Thrombocyte count. e GLP-2. f OGTT](/cms/asset/502c9910-148a-4149-8fec-98f8931d02a2/kbie_a_1958600_f0006_oc.jpg)