Figures & data
Figure 1. circPPFIA1 expression is upregulated in both LSCC tissues and cells. (a) A screen based on the GEO dataset is shown. (b) after RNase R treatment, RNA expression levels were evaluated via a qPCR assay (n = 3). (c) after actinomycin D treatment for 0, 4, 8, or 12 h, RNA expression levels were evaluated via a qPCR assay (n = 3). (d) circPPFIA1 expression was measured by qPCR in LSCC tissues and the corresponding para-cancerous tissue (n = 30). (e) qPCR was conducted to measure circPPFIA1 expression in LSCC cell lines (TU212, TU177, LSC-1, TU686, and AMC-HN-8), using NHBEC cells as a control (n = 3). **P < 0.01 vs the NHBEC group
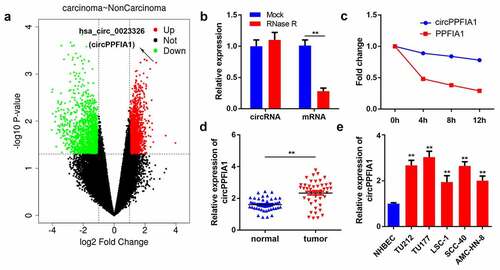
Figure 2. The effects of circPPFIA1 silencing on the proliferation and invasion of LSCC cells. (a) The transfection efficiency of si-circPPFIA1, oc-circPPFIA1 or their negative control in TH177 and TU212 cells was detected via qPCR (n = 3). (b) The proliferation of transfected TH177 and TU212 cells was tested via the MTT assay (n = 6). (c) A colony formation assay was performed to detect the growth of LSCC cells (n = 6). (d, e) Cell migration and invasion ability were analyzed via a matrigel transwell assay using transfected TH177 and TU212 cells (n = 6). **P < 0.01
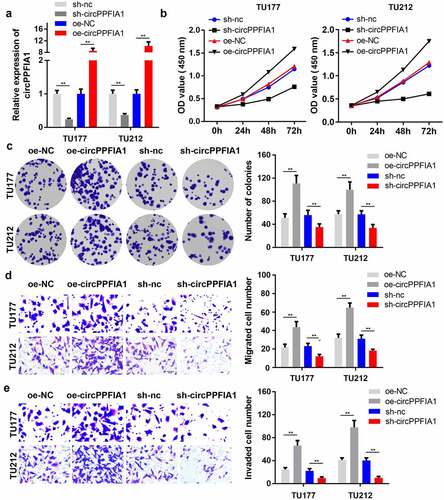
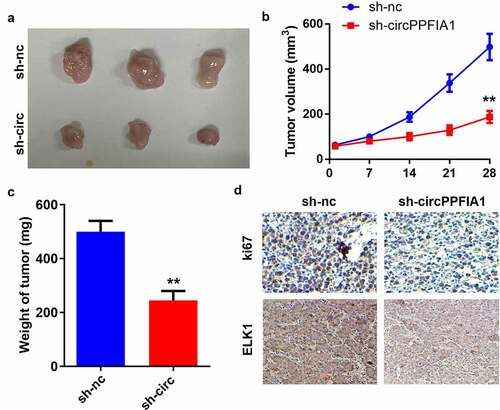
Figure 3. circPPFIA1 knockdown inhibited the growth of LSCC cells in vivo. TU212 cells with stably silenced circPPFIA1 and normal TU212 cells were injected into mice to establish an in vivo mouse model. (a) images of tumors from the mice of the sh-nc and sh-circPPFIA1 groups are shown (n = 6). (b) the growth curves of the tumors. (c) tumor weights were determined and are shown (n = 6). (d) IHC was performed to detect the expression of Ki67 and SOCS6 in the tumor tissues (n = 6). **P < 0.01 vs the sh-nc group
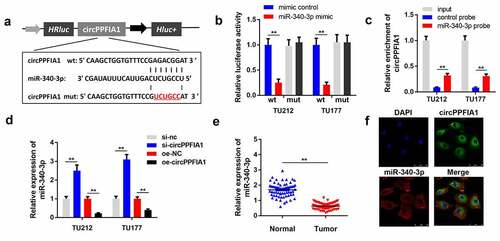
Figure 4. circPPFIA1 acted as a sponge of miR-340-3p. (a) The predicted wt and mut circPPFIA1 binding sites in miR-340-3p. (b) TH177 and TU212 cells were co-transfected with wt circPPFIA1 or mut circPPFIA1 and mimic plasmids. A luciferase assay was performed to detect the binding between circPPFIA1 and miR-340-3p (n = 3). (c) An RNA pull-down assay was performed to further verify the interaction between circPPFIA1 and miR-430-3p (n = 3). (d) qPCR was conducted to evaluate the expression of miR-340-3p (n = 3). (e) miR-340-3p expression levels were measured in 30 pairs of LSCC tissues and adjacent normal tissues (n = 30). (f) A FISH assay was performed to detect the locations of circPPFIA1 and miR-340-3p (n = 3). **P < 0.01
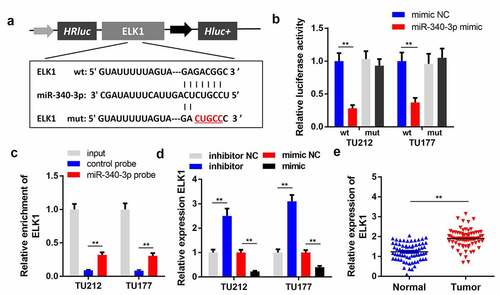
Figure 5. ELK1 is a target of miR-340-3p. (a) the predicted binding site of ELK1 and miR-340-3p is shown. (b) the target relationship between ELK1 and miR-340-3p was confirmed via a dual-luciferase reporter assay (n = 3). (c) an RNA pull-down assay was performed to detect the direct interaction between miR-340-3p and ELK1(n = 3). (d) ELK1 levels were measured via qPCR in miR-340-3p-overexpressing or silenced LSCC cells (n = 3). (D) ELK1 levels were measured in 30 paired normal and tumor tissues via qPCR (n = 30). **P < 0.01
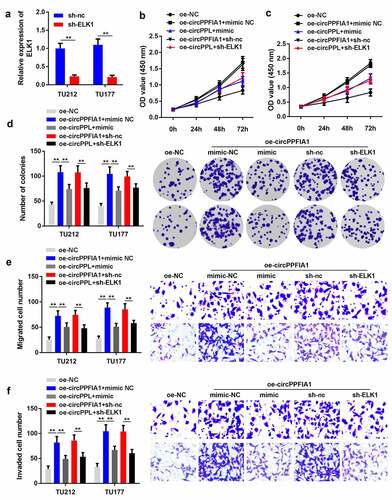
Figure 6. miR-340-3p suppressed the biological functions of LSCC by targeting ELK1. (a) transfection efficiency was measured via qPCR in transfected TH177 and TU212 cells (n = 3). (b, c) cell proliferation was measured via the MTT assay (n = 6). (d) Colony formation was determined, and the number of colonies was quantified (n = 6). (e) cell migration and invasion capability was measured using the Transwell assay (n = 6). **P < 0.01