Figures & data
Figure 1. NAFLD models established to investigate changes in AC012668 expression. (a) Heat map of differentially expressed lncRNAs in NAFLD. (b) Cell viability and (c and d) apoptosis of LO2 cells treated with FFA. (e and f) Oil-Red O staining image and TG level in the liver tissues of HFD mice. (g) AC012668 expression levels in the liver tissues of HFD mice. (h) Expression of AC012668 in FFA-treated cells. *P < 0.05 vs. control; **P < 0.01 vs. control
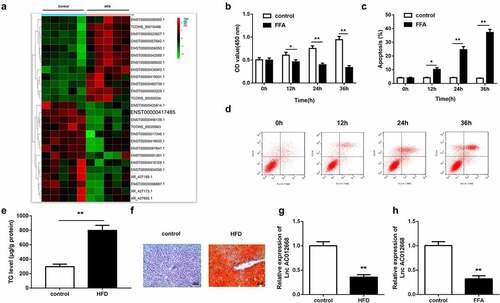
Figure 2. AC012668 suppresses TG/lipid accumulation and lipogenesis in LO2 cells. (a) AC012668 expression level in FFA-treated LO2 cells transfected with the AC012668 overexpression plasmid. (b) mRNA and (c and d) protein expression levels of SCD1, SREBP1, and FAS in FFA-treated LO2 cells. (e) TG level and (f) Oil-Red O staining in FFA-treated LO2 cells. *P < 0.05 vs. pcDNA3.1 or AC012668.
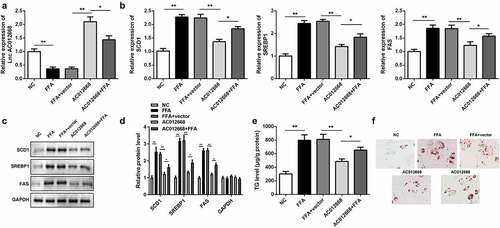
Figure 3. miR-380-5p directly targets AC012668. (a) Wild and mutant types of AC012668 reporters labeled with luciferase. (b) Expression levels of miR-380-5p in AC012668-enhanced/-inhibited LO2 cells. (c) Relative luciferase activities in wild-type and mutant AC012668 groups compared with the mimic negative control group. (d) Relative enrichment of AC012668 in the biotinylated miR-380-5p group. (e) AC012668 expression levels in the liver tissues of HFD mice. (f) Expression level of miR-380-5p in LO2 cells treated with 1 mM FFA. *P < 0.05 vs. biotin-NC; **P < 0.01 vs. si-NC, vector, mimic NC, or control
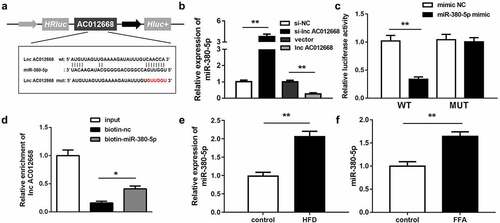
Figure 4. miR-380-5p promotes TG/lipid accumulation and lipogenesis in LO2 cells transfected with AC012668. (a) AC012668 expression detected using reverse transcription-quantitative polymerase chain reaction. (b) mRNA and (c and d) protein levels of SCD1, SREBP1, and FAS. (e) TG level and (f) lipid deposition. *P < 0.05 vs. AC012668 + mimic NC; **P < 0.01 vs. vector
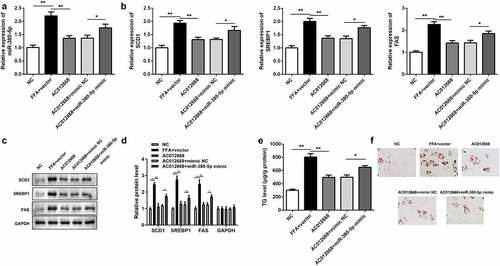
Figure 5. LRP2 is a target of miR-380-5p. (a) Wild and mutant types of LRP2 reporters labeled with luciferase. (b) mRNA expression of LRP2 in FFA-treated LO2 cells transfected with the miR-380-5p mimic or inhibitor. (c) Relative luciferase activities in wild-type and mutant LRP2 groups compared with the mimic negative control group. (d) Relative enrichment of LRP2 in the biotinylated miR-380-5p group. (e) AC012668 expression levels in the liver tissues of HFD mice. (f) Expression level of LRP2 in FFA-treated LO2 cells. *P < 0.05 vs. biotin-NC; **P < 0.01 vs. inhibitor NC, mimic NC, or control
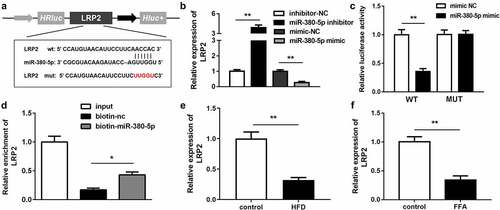
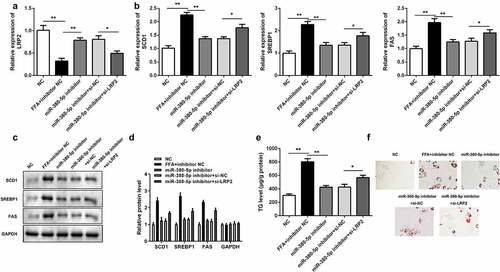
Figure 6. Effects of LRP2 knockdown on TG/lipid accumulation and lipogenesis in miR-380-5p-inhibited LO2 cells. (a) miR-380-5p expression level in LO2 cells cotransfected with the miR-380-5p inhibitor and si-LRP2. (b) mRNA and (c and d) protein levels of SCD1, SREBP1, and FAS in the miR-380-5p inhibitor- and si-LRP2-cotransfected cells. (e) TG level and (f) lipid deposition in the miR-380-5p inhibitor- and si-LRP2-cotransfected cells. *P < 0.05 vs. control or miR-380-5p mimic + si-NC