Figures & data
Table 1. Nucleotides and amino acid changes in KRAS gene in CRC patients
Figure 1. Chromatograms showing mutations in KRAS gene in representative patients
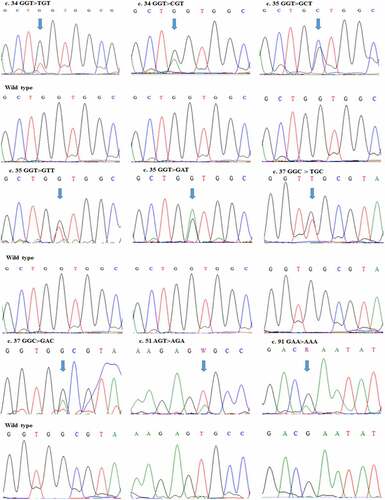
Table 2. Characteristics of CRC patients with KRAS mutations
Figure 2. KRAS homology model of wild and mutated proteins. KRAS model was build using Swiss Model automated homology modeling platform based on the FASTA sequence downloaded from the UniProt Knowledgebase: (a) KRAS homology model of wild type (WT) protein showing the Ser at the 17th position (b) KRAS homology model of the novel missense mutation identified in our study showing the substitution of Ser with Arg at the 17th position
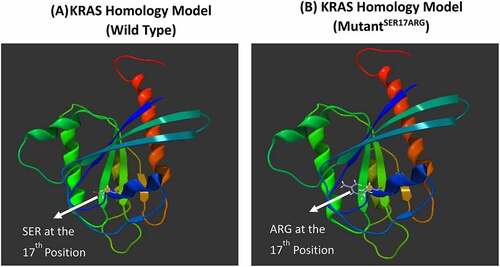
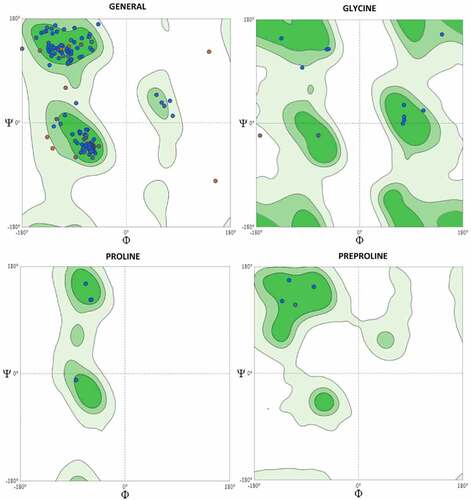
Figure 3. Ramachandran Plots for KRAS Homology Model (Wild Type). The Ramachandran plots of the KRAS homology model showed that 93.22% of residues were in the favored region, 2.26% were in the outlier region, rotamer outliers were 3.80%, C-beta deviations were 4, bad bonds were 0 out of 1453, bad angles were 34 out of 1951 and Cis Non-Proline 2/174