Figures & data
Figure 1. Workflow of the study design
Figure 2. WGCNA analysis and module identification. a) Sample dendrogram and trait indicator. b) The scale-free index and mean connectivity of different soft-threshold powers (β). c) Construction of gene co-expression modules. d) Correlation analysis of different modules and T-cell infiltration
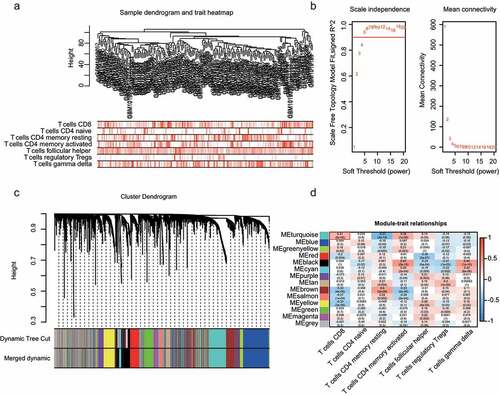
Figure 3. GO and KEGG analysis. a) GO enrichment analysis of the turquoise module genes. b) KEGG pathway analysis of turquoise module genes
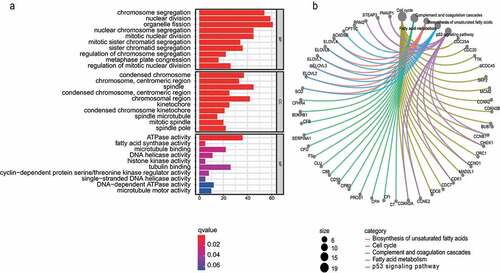
Figure 4. Identification of hub genes. a) Top 30 targets in the protein–protein interaction (PPI) network. b) Top sub‐network from PPI network. c) Hub genes were selected based on overlap between highly connected genes and candidate hub genes
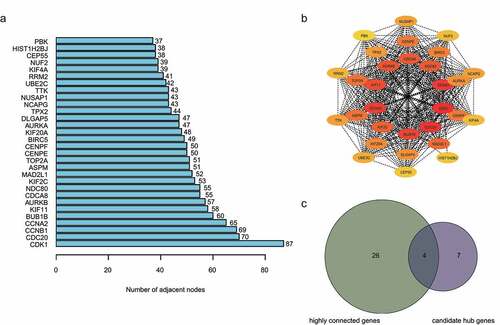
Figure 5. Validation of the hub genes. a) Validation of hub gene mRNA expression in TCGA database. b) Differential expressed genes identified in the HPA database. c) Summary of meta-analysis of datasets from Oncomine database, red denotes significant overexpression. d) Overall survival (OS) analysis of the four hub genes
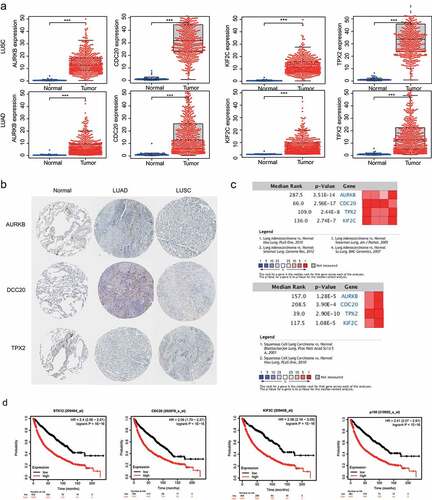
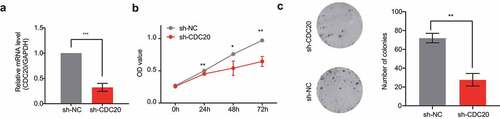
Figure 6. Effects of knocking down of CDC20. a) Analysis of CDC20 mRNA levels in cells that transfected with sh‐NC or sh‐CDC20. b-c) CCK-8 and colony formation assay results showing the inhibition of cell proliferation by CDC20 knockdown