Figures & data
Figure 1. The network pharmacology prediction of curcumin and toxicology measurement. (a) The network prediction of the potential targets of curcumin. (b) The toxicology of curcumin was detected by the MTT assay. (c) The wound area (%) of ACHN cells incubated with 5, 15 and 30 µM of curcumin was detected by the scratch assay. (d) The number of colonies (%) of ACHN cells incubated with 5, 15 and 30 µM of curcumin was detected by the colony formation assay. (e) The flow cytometry analysis showing the apoptosis rate of ACHN cells incubated with 5, 15 and 30 µM of curcumin. The value was displayed as the mean ± SD. *P < 0.05, **P < 0.01
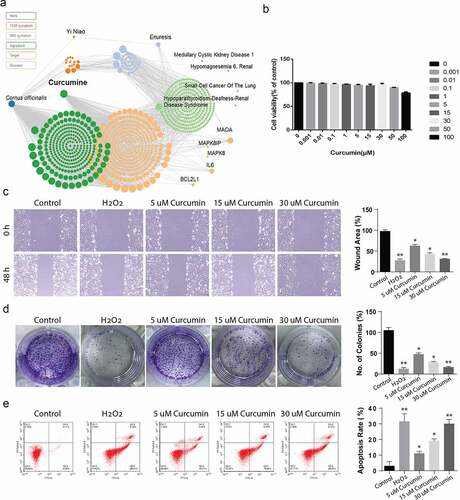
Figure 2. Curcumin suppresses the IL-6, IL-8 and TNF-a inflammation factors release. (a) TNF-a, (b) IL-6 and (c) IL-8. The levels of cytokines expressions were determined by ELISA. The values presented are the mean ± SD derived from three independent experiments performed in duplicate and expressed as pg/ mg. The value was displayed as the mean ± SD (n = 6). A one-way analysis of variance was used to calculate the significance of each group, and the variance was corrected using Tukey test. Compared with the Control group, *P < 0.05
Figure 3. Curcumin promotes the apoptosis and activates the AKT/mTOR pathway. (a) Detection of poptosis was done using Annexin V-FITC/PI kit and flow cytometry (b) Graphical representation of quantified apoptosis following treatment with various doses of curcumin or treatment with curcumin in combination with other drugs. (c) Immunofluorescence assay showing the expression of p-AKT following the treatments of ACHN cells with 15 µM curcumin, 30 µM, curcumin, 50 uM curcumin, or 30 µM curcumin+ 3-MA. (d) Quantification of p-AKT immunofluorescence results. The value was displayed as the mean ± SD. A one-way analysis of variance was used to ddetermine the level of significance of each group, in comparison to the control group and the variance was corrected using Tukey’s test.Compared with the Control group, *P < 0.05; Compared with the 30 μM group, ^P < 0.05
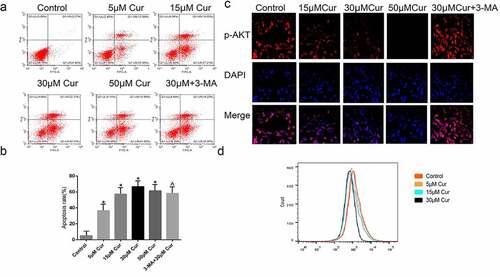
Figure 4. Curcumin induce autophagy reversed by the autophagy suppressors’ 3-MA and CQ. (a) Western blot assessment of autophagy related LC3B, Beclin-1 and p62, and AKT/mTOR pathway proteins expressed in ACHN cells following treatment with 15 µM, 30 µM curcumin, 15 µM curcumin+ 3-MA, 15 µM curcumin + CQ or 15 µM curcumin +Z-VAD. (b) Immunofluorescence assessment of LC3B following the various stated treatments was reflected by the immunofluorescence and (c) Graphical quantification of LC3B protein after various treatments. The value was presented as the mean ± SD. A one-way analysis of variance was used to calculate the significance of each group, in comparison to the control and the variance was corrected using Tukey’s test. Compared with the Control group, *P < 0.05 was regarded as significant; Compared with the 15 μM Cur group, ^P < 0.05; GAPDH was used as the internal control
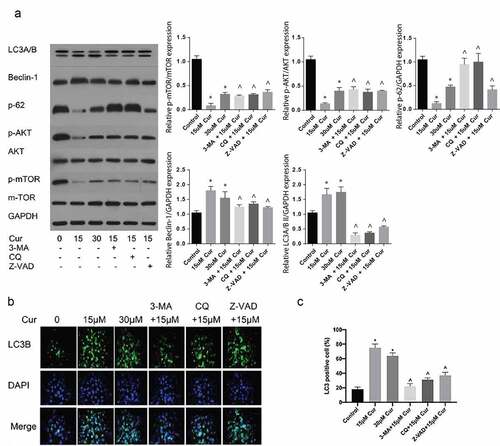
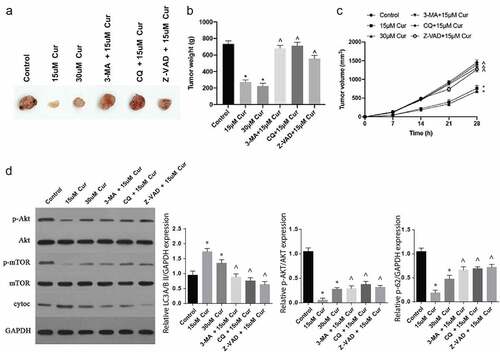
Figure 5. Curcumin inhibits tumor growth in vivo through the Akt/mTOR pathway modulation