Figures & data
Figure 1. Ramelteon ameliorated MPP+-caused decreased cell viability in human SH-SY5Y cells. (a). Molecular structure of Ramelteon; (b). The effects of Ramelteon alone in cell viability of human SH-SY5Y cells. Cells were cultured with Ramelteon alone at the concentrations of 0, 0.5, 1, 5, 25, 50, 100, 500, and 1000 nM for 36 hours. (c) Cells were stimulated with MPP+ (500 µM) with or without Ramelteon (5, 25, 50, and 100 nM) for 36 hours. Cell viability was measured using CCK-8 (#, ##, ###, P < 0.05, 0.01, 0.005 vs. vehicle group; *, **, ***, P < 0.05, 0.01, 0.005 vs. MPP+ group, N = 5–6)
Figure 2. Ramelteon alleviated MPP+-induced oxidative stress. (a). The levels of mitochondrial ROS; (b). Levels of protein carboxyl (###, P < 0.005 vs. vehicle; **, ***, P < 0.01, 0.005 vs. MPP+, N = 5–6)
Figure 3. Ramelteon reduced MPP+-caused upregulation of NOX-4. (a). mRNA of NOX-4; (b). Protein level of NOX-4 (###, P < 0.005 vs. vehicle; **, ***, P < 0.01, 0.005 vs. MPP+, N = 5)
Figure 4. Ramelteon prevented MPP+-induced mitochondrial dysfunction. Cells were stimulated with MPP+ (500 µM) with or without Ramelteon (50, and 100 nM) for 36 hours. Levels of ΔΨm were examined using RH123. Scale bar, 50 μm. (###, P < 0.005 vs. vehicle; **, ***, P < 0.01, 0.005 vs. MPP+, N = 4–5)
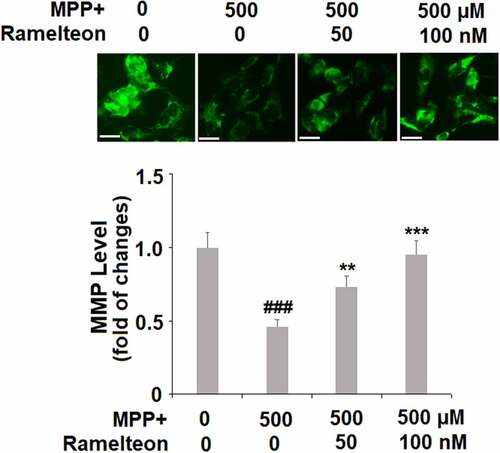
Figure 5. Ramelteon attenuated MPP+-induced apoptosis. Cells were incubated with MPP+ (500 µM) or Ramelteon (50, and 100 nM) for 36 hours. Cell apoptosis (###, P < 0.005 vs. vehicle; **, ***, P < 0.01, 0.005 vs. MPP+, N = 5) was determined by TUNEL
Figure 6. Ramelteon resorted MPP+-induced increase in the ratio of Bax/Bcl-2 Proteins of Bax and Bcl-2 were measured and the ratio of Bax/Bcl-2 was determined (###, P < 0.005 vs. vehicle; **, ***, P < 0.01, 0.005 vs. MPP+, N = 5)
Figure 7. Ramelteon inhibited MPP+-caused release of cytochrome C from mitochondria to cytosol and the level of cleaved Caspase 3 (a). The levels of cytochrome C in the cytosol; (b). The level of cleaved Caspase-3 (###, P < 0.005 vs. vehicle; **, ***, P < 0.01, 0.005 vs. MPP+, N = 5)