
Figures & data
Table 1. The relationship between CLR and clinicopathological features of CRC patients
Figure 1. Violin plots show the relationship between CLR and clinical features. The clinical features include age, gender, tumor location, left- and right-sided CRC, T stage, N stage, M stage, TNM stage, KRAS mutation, microsatellite, and differentiation. Except for N stage and KRAS mutation, other parameters are statistically significant
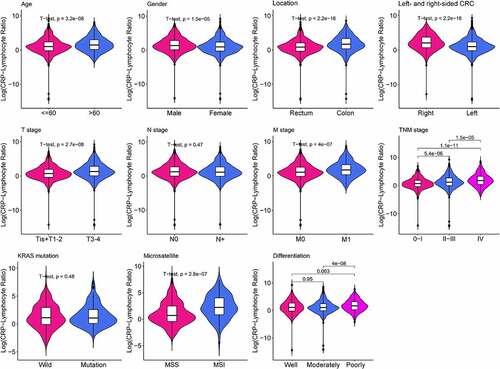
Figure 2. Kaplan–Meier curves of overall survival in patients stratified by CLR ratio. (a) Kaplan–Meier curves of overall survival in all CRC patients. The value of CLR above 5 means high level group and vice versa. (b) Kaplan–Meier curves of overall survival in stage I–II CRC patients. (c) Kaplan–Meier curves of overall survival in stage III–IV CRC patients
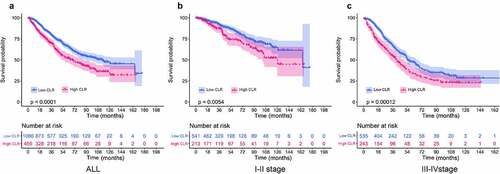
Figure 3. Impact of CLR combined with other clinical features on prognosis. Age subgroup: high CLR, age>60 group means poor prognosis. Gender subgroup: high CLR, female group means poor prognosis. Left-right subgroup: high CLR, right group means poor prognosis. KRAS subgroup: high CLR, mutation KRAS group means poor prognosis. MMR subgroup: high CLR, MSS group means poor prognosis
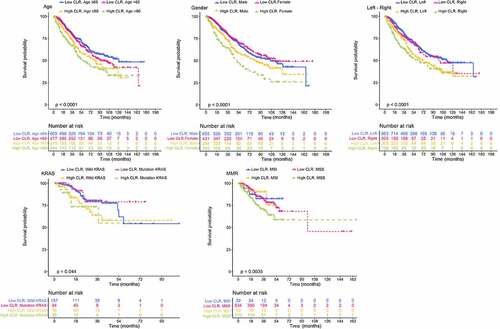
Figure 4. Univariate and multivariate analyses of the potential predictive factors for overall survival. (a) Univariate analysis of clinicopathological factors for overall survival. (b) Multivariate analysis of clinicopathological factors for overall survival
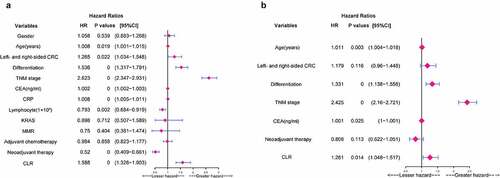
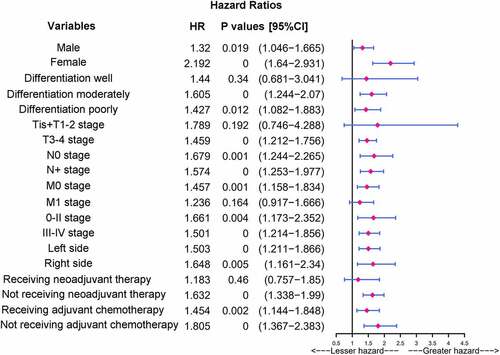
Figure 5. Subgroup analysis of CRC patients stratified by baseline features in the high CLR group. Univariate analysis of the CLR values of baseline features for overall survival in the high CLR group
Availability of data and material
All original data included in the manuscript are available upon reasonable request.