
Figures & data
Table 1. The clinicopathological characteristics of the 40 breast cancer patients included
Table 2. The primer sequences for RT-PCR
Figure 1. Expression characteristics of VCAN-AS1 and miR-106a-5p in BC tissues and cells
Forty pairs of BC tissues and healthy tissues adjacent to cancer were collected. (a-b). RT-PCR was carried out to detect VCAN-AS1 (a) and miR-106a-5p (b) expression levels. (c) Linear regression analysis of the correlation between VCAN-AS1 and miR-106a-5p in BC tissues. (d-e) RT-PCR was used to compared VCAN-AS1 and miR-106a-5p levels in MCF7, MDA-MB-453, MDA-MB-231 and BT-549 as well as human normal mammary epithelial cell line (MCF-10A). (f-g) The relationship between VCAN-AS1 (f), miR-106a-5p (g) and the prognosis of BC patients was analyzed by Kaplan–Meier Plotter survival curve. (h) Analysis of miR-106a-5p expression with the overall survival of BC patients by Kaplan–Meier Plotter (http://kmplot.com/analysis/). NS, **, *** indicates p > 0.05, p < 0.01 and p < 0.001 vs. the Normal or MCF-10A group, respectively.
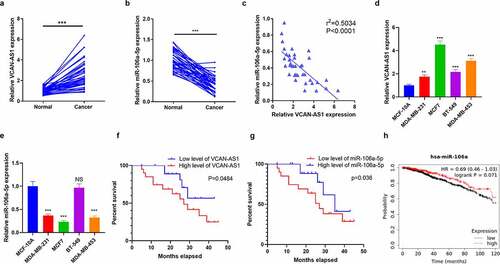
Figure 2. VCAN-AS1 targets miR-106a-5p
(a) Through LncBase v.2 database (http://starbase.sysu.edu.cn/), it was predicted that miR-106a-5p contains a site that is complementary to VCAN-AS1. (b-c) Using dual luciferase activity experiments to verify the regulatory relationship between miR-106a-5p and VCAN-AS1. (d-e) RT-PCR was carried out to detect the enrichment levels of VCAN-AS1 (d) and miR-106a-5p (e) in RIP lysates. (f) VCAN-AS1 overexpressing vectors were transfected into MCF7 and MDA-MB-453, and the level of miR-106a-5p in the cells was evaluated via RT-PCR. (g) si-VCAN-AS1 or si-NC vectors were transfected into MDA-MB-231 and BT-549. h. The level of miR-106a-5p in the cells was evaluated via RT-PCR. NS means p > 0.05, ** means p < 0.01, *** means p < 0.001.
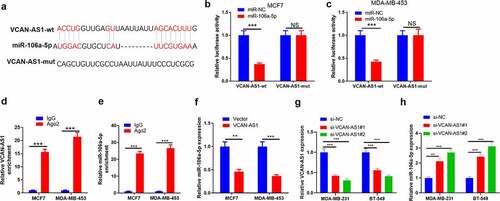
Figure 3. Effects of VCAN-AS1 and miR-106a-5p on BC cell proliferation and apoptosis
BC cells MCF7 and MDA-MB-453 were transfected with VCAN-AS1 overexpression plasmid and/or miR-106a-5p mimic, respectively (a-b). RT-PCR was performed to measure the expression of VCAN-AS1 (a) and miR-106a-5p (b). (c-d) Cell viability was detected using the CCK8 method. (e) The cell proliferation ability was examined via the BrdU method. (f) The cell colony ability was examined via the colony formation method. (g) Flow cytometry detection of cell apoptosis rate. (h-i) The expression of apoptosis-related proteins Bcl-2, Caspase 3 and Bax were measured by western blot. ** p < 0.01, *** p < 0.001 vs. control group, # p < 0.05, ## p < 0.01, ### p < 0.001 vs. VCAN-AS1 group, && p < 0.01, &&& p < 0.001 vs. miR-106a-5p group.
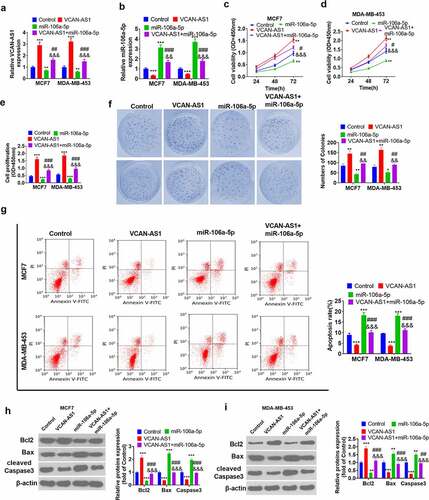
Figure 4. Effect of VCAN-AS1 and miR-106a-5p on BC cell migration, invasion and EMT (a-b)
Transwell test was employed to detect MCF7 and MDA-MB-453 cell migration (a), invasion ability (b), (c-d). Changes in EMT-related proteins (E-cadherin, Vimentin and N-cadherin) were measured via western blot. * p < 0.05, ** p < 0.01, *** p < 0.001 vs. control group, ## p < 0.01, ### p < 0.001 vs. VCAN-AS1 group, && p < 0.01, &&& p < 0.001 vs. miR-106a-5p group.
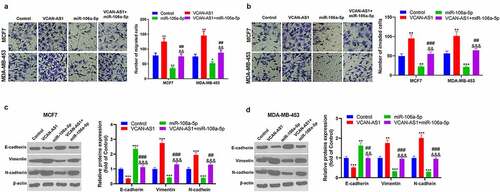
Figure 5. STAT3/ HIF-1α is the downstream target of miR-106a-5p
(a). Through mirPath v.3 (http://snf-515788.vm.okeanos.grnet.gr/index.php?r=mirpath), we predicted the potential signaling pathways of miR-106a-5p, including pathways in cancer (containing 42 genes). (b) Use starbase to predict the potential molecular targets of miR-106a-5p, and analyze the miR-106a-5p shared by five databases (miRanda, targetscan, pictar, miRmap and microT) using Wayne map target. (c). Analysis of the common target predicted by miR-106a-5p in mirPath v.3 and starbase using Wayne diagrams. (d) STAT3 contains base-pairing sites with miR-106a-5p. (e) The dual luciferase activity experiment was used to verify the targeting relationship between STAT3 and miR-106a-5p. (f) The mRNA expression levels of STAT3 were detected via RT-PCR. (g-h) The levels of HIF-1α and STAT3 were detected by western blot. NS means p > 0.05, ** p < 0.01, *** p < 0.001 vs. control group, ## p < 0.01, ### p < 0.001 vs. VCAN-AS1 group, &&& p < 0.001 vs. miR-106a-5p group.
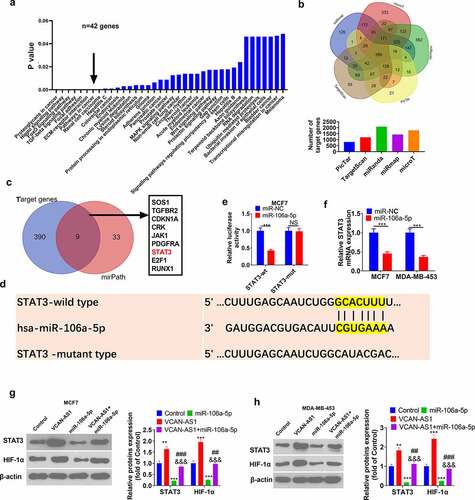
Figure 6. Activating the STAT3 pathway reverses miR-106a-5p-mediated antitumor effects
BC cells MCF7 were transfected with miR-106a-5p mimics and/or treated with IL-6. (a-b) RT-PCR was performed to measure the expression of VCAN-AS1 (a) and miR-106a-5p (b). (c) Cell viability was detected using the CCK8 method. (d) The cell proliferation ability was examined via the BrdU method. (e) The cell colony ability was examined via the colony formation method. (f) Flow cytometry detection of cell apoptosis rate. (g) The expression of apoptosis-related proteins Bcl-2, Caspase3 and Bax were measured by western blot. (h) Transwell test was employed to detect MCF7 cell migration and invasion ability. (i) Changes in EMT-related proteins (E-cadherin, Vimentin and N-cadherin) were measured via western blot. ** p < 0.01, *** p < 0.001 vs. control group, ## p < 0.01, ### p < 0.001 vs. IL-6 group, & p < 0.05, && p < 0.01, &&& p < 0.001 vs. miR-106a-5p group.
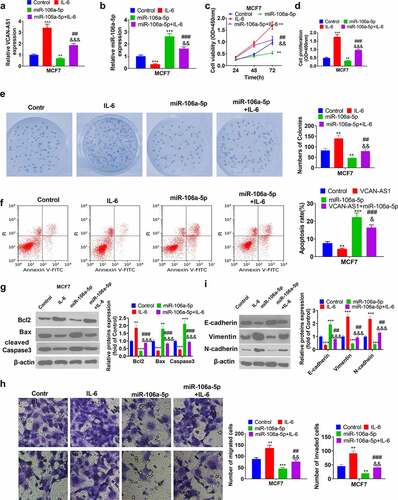
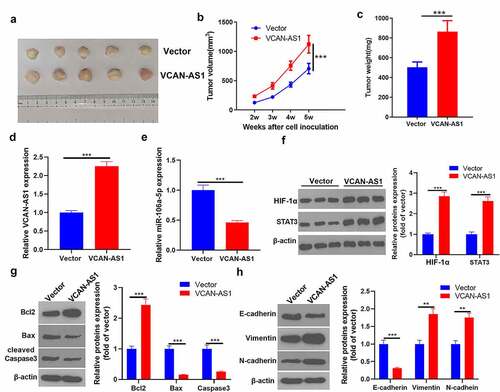
Figure 7. Overexpression of VCAN-AS1 promotes tumor growth and EMT by regulating the miR-106a-5p/STAT3/HIF-1α pathway
(a). MCF7 was taken to transfect VCAN-AS1 and vector respectively, and tumor xenograft model was constructed. (b) The tumor volume changes. (c) The mice were sacrificed at the fifth week, and the tumor mass was measured. (d-e) Detection of VCAN-AS1 (d) and miR-106a-5p (e) expression in tumor tissues by RT-PCR. (f-h) The expression of STAT3/HIF-1α (f), apoptosis-related protein (g) and EMT-related protein (h) was detected via western blot. ** means p < 0.01, *** means p < 0.001.
Supplemental material