Figures & data
Table 1. The primer sequences for qRT-PCR
Table 2. Correlation between CDKN2B-AS1 and CRC patients’ clinical features
Figure 1. Examination of CDKN2B-AS1 expression in human CRC tissues and cell lines. (a) CDKN2B-AS1 expression was explored in human CRC tissues compared with adjacent normal tissues by qRT-PCR method, n = 39. (b) CDKN2B-AS1 expression was determined in CRC cell lines including HT29, Caco2, SW480, and SW1116 and a normal human colon epithelial cell line NCM460, n = 6. (c)(d) shRNAs targeting CDKN2B-AS1 were transfected into HT29 cells and Caco2 cells prior to the analysis of CDKN2B-AS1 expression, n = 6. *P < 0.05 compared with adjacent tissues, NCM460 cells or control cells. **P < 0.01 compared with NCM460 cells or control cells
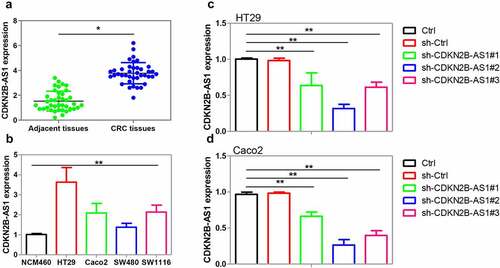
Figure 2. The effect of CDKN2B-AS1 knockdown on CRC cell proliferation and migration. (a)(b) Cell proliferation was evaluated by CCK-8 assay in HT29 cells and Caco2 cells after knockdown of CDKN2B-AS1, n = 6. (c)(d)(e)(f) Analysis and quantification of Ki-67 and PCNA protein expression by Western blot in HT29 cells and Caco2 cells after knockdown of CDKN2B-AS1, n = 4. (g)(h) Clone formation assay for the clone formation ability of HT29 and Caco2 cells after downregulation of CDKN2B-AS1, n = 4. (i)-(l) Detection of cell migration by Transwell assay in HT29 cells and Caco2 cells, n = 4. *P < 0.05, **P < 0.01 compared with control cells
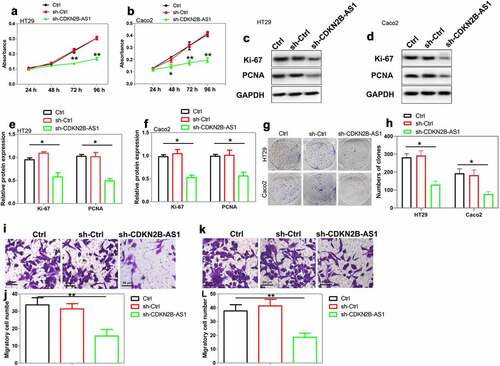
Figure 3. The effect of CDKN2B-AS1 overexpression on CRC cell proliferation and migration. (a)(b) Analysis of CDKN2B-AS1 expression in SW480 cells and SW1116 cells after lentivirus vectors transfection, n = 4. (c)(d) Evaluation of cell proliferation by CCK-8 assay in SW480 cells and SW1116 cells with CDKN2B-AS1 overexpression, n = 6. (e)(f)(g)(h) Analysis and quantification of Ki-67 and PCNA protein expression by Western blot in SW480 cells and SW1116 cells with CDKN2B-AS1 overexpression, n = 4. (i)(j) (k)(l) Transwell assay was used to detect the migration of SW480 cells and SW1116 cells with CDKN2B-AS1 overexpression, n = 4. *P < 0.05, **P < 0.01 compared with control cells
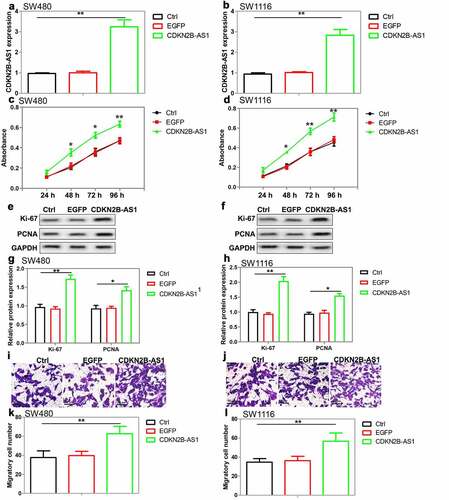
Figure 4. The interaction between CDKN2B-AS1 and miR-378b in CRC cells. (a) Starbase 2.0 database predicted that miR-378b and miR-378e were two microRNAs that potentially bind to CDKN2B-AS1. (b) Expression analysis of miR-378b and miR-378e in the normal human colon epithelial cell line NCM460 and colorectal cancer cells, n = 4. (c) (d) Analysis of miR-378b and miR-378e expression in SW480 cells with CDKN2B-AS1 knockdown and overexpression, n = 4. (e) The expression of miR-378b was analyzed in primary CRC tissues and adjacent tissues, n = 39. (f)The level of CDKN2B-AS1 captured by biotinylated wild-type/mutant miR-378b in CRC cells was analyzed using qRT-PCR, n = 3. (g) Interaction between CDKN2B-AS1 and miR-378b was validated by luciferase reporter assay, n = 4. (h) The enrichment of CDKN2B-AS1 with AGO2 was evaluated by RIP in CRC cells with miR-378b overexpression, n = 3. (i) CRC cell proliferation was detected after CDKN2B-AS1 knockdown with or without miR-378b inhibitor, n = 6. (j) (k) Observation of HT29 cell migration after CDKN2B-AS1 knockdown with or without miR-378b inhibitor, n = 4. I indicates control group, II indicates sh-CDKN2B-AS1 group, III indicates sh-CDKN2B-AS1+ anti-miRNA-NC group, IV indicates sh-CDKN2B-AS1+ anti-miR-378b group. *P < 0.05, **P < 0.01 compared with adjacent tissues or control cells, #P < 0.05 compared with sh-CDKN2B-AS1 group
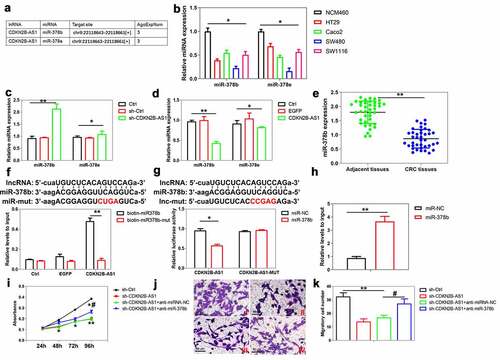
Figure 5. Screening of downstream targets for miR-378b in CRC cells. (a) Intersection between miR-378b potential target genes (Starbase 2.0) and genes associated with the overall survival of CRC patients (LinkedOmics database). (b)(c)(d)(e)(f) GEPIA database validated that HIST2H4A, SHANK3, CAPRIN2, GPR156, DCAT1 were significantly related to the overall survival of CRC patients. (g) Analysis of CAPRIN2 mRNA expression in CRC tissues and adjacent tissues, n = 39. (h) (j) (l) Exploration of CAPRIN2 mRNA and protein expression in SW480 cells after miR-378b mimic transfection, n = 4. (i)(k)(m) The mRNA and protein expression of CAPRIN2 was assayed in CRC cells after miR-378b inhibitor transfection, n = 4. *P < 0.05 compared with adjacent tissues or control cells
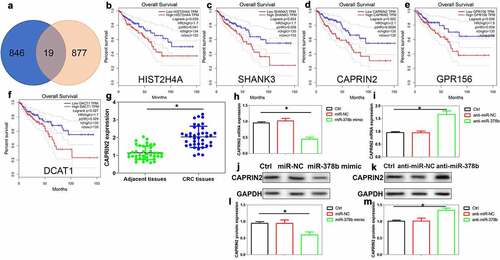
Table 3. Correlation between CAPRIN2 and CRC patients’ clinical features
Figure 6. The role of CAPRIN2 in CRC cells. (a) The interaction between miR-378b and CAPRIN2 3ʹ-UTR was confirmed using the luciferase reporter assay, n = 4. (b)(c) The expression of CAPRIN2 was analyzed by Western blot in HT29 cells with CDKN2B-AS1 knockdown, n = 4. (d) (e)The levels of CAPRIN2 and β-catenin were measured by Western blot in SW480 cells after CDKN2B-AS1 overexpression with or without miR-378b, n = 4. (f) Delineating SW480 cell proliferation after CAPRIN2 knockdown with or without CDKN2B-AS1 overexpression, n = 6. (g)(i) SW480 cells were transfected with CAPRIN2 shRNA with or without CDKN2B-AS1 overexpression, and cell migration was observed by transwell assay, n = 4. I indicates control group, II indicates shRNA-NC group, III indicates sh-CAPRIN2, IV indicates shRNA-CN+CDKN2B-AS1 group, V indicates sh-CAPRIN2+ CDKN2B-AS1 group. (h)(j) Analysis of CAPRIN2 and β-catenin expression in SW480 cells after CAPRIN2 knockdown with or without CDKN2B-AS1 overexpression, n = 4. Except specially indicated, *P < 0.05, **P < 0.01 compared with the control group; #P < 0.05 compared with shRNA-CN+CDKN2B-AS1 group
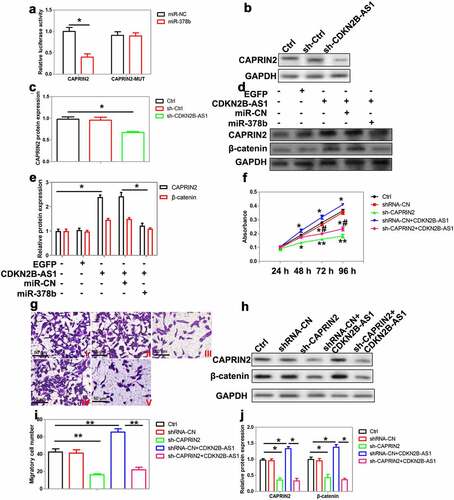
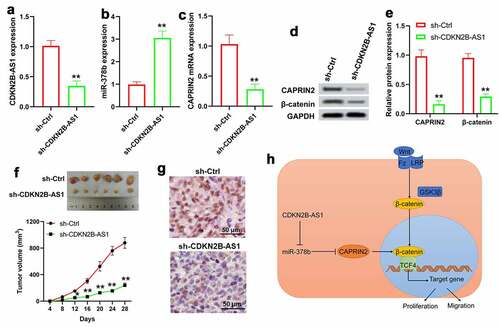
Figure 7. Downregulation of CDKN2B-AS1 suppressed tumor growth in a xenograft mouse model. qRT-PCR assay for the expression of CDKN2B-AS1 (a), miR-378b (b) and CAPRIN2 (c). (d) and (e) Western blot was used to detect the protein levels of CAPRIN2 and β-catenin in tumors. (f) Tumor images of mice after sacrificed as well as tumor volume. (g) Immunohistochemical staining for Ki-67. (h) Possible mechanism of CDKN2B-AS1 in CRC through miR-378b mediated regulation of CAPRIN2 and β-catenin expression. n = 6. *P < 0.05, **P < 0.01 compared with the sh-Ctrl group