Figures & data
Table 1. Factors and their levels for Box-Behnken design
Table 2. Box-Behnken design matrix with actual and coded values (in parenthesis), and the response and predict values of reducing sugar from the hydrolysis of untreated rice straw
Table 3. ANOVA analysis of the model for the response
Table 4. Model parameter estimates (regression analysis) of the quadratic model for reducing sugar release from the hydrolysis of untreated rice straw
Figure 1. Plot of experimental data versus predicted data for reducing sugar release
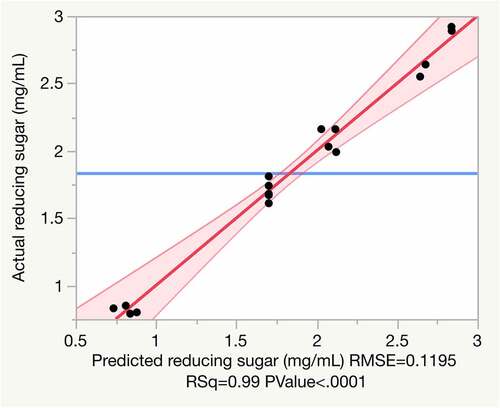
Figure 2. Interaction profiler showing the interactive effect of factors for reducing sugar release. Interactions between terms are shown as crossed lines or lines of different slopes. No interactive effects are shown as parallel lines
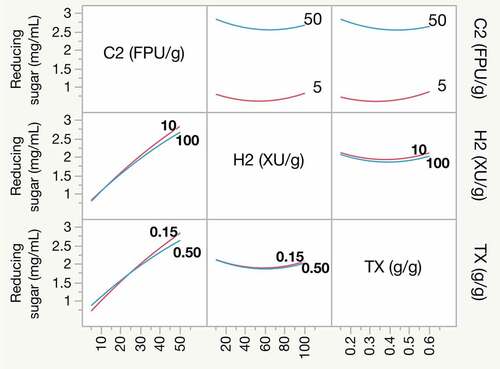
Figure 3. Prediction profiler and desirability of reducing sugar release. The prediction profiler depicts the effects of Cellic Ctec2 (C2) cellulase, Cellic Htec2 (H2) xylanase, and Triton X-100 (TX) on reducing sugar release. The black lines indicate the prediction trace; the dotted vertical red line refers to the current dosage of factor; the value in red on the vertical axis predicted response based on loads of individual independent variables
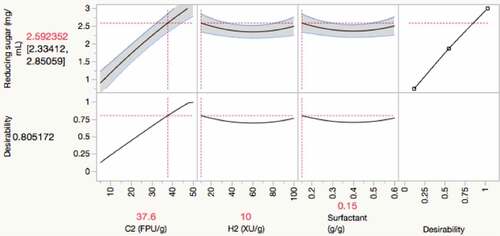
Figure 4. Comparison of reducing sugar release from enzymatic hydrolysis of untreated rice straw in the absence and presence of Triton X-100
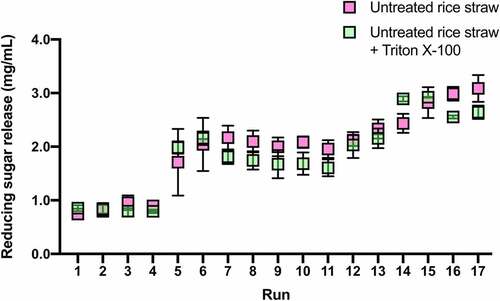
Figure 5. TLC analysis of hydrolysis products from untreated rice straw hydrolyzed in (a) the absence and (b) the presence of Triton X-100. The samples were incubated at 55°C with an agitation rate of 180 rpm for 24 h. The molecular size marker lane (G1-G6) contains a mix of celloligosaccharides, including glucose (G1), cellobiose (G2), cellotriose (G3), cellotetraose (G4), cellopentaose (G5), and cellohexaose (G6). The molecular size marker lane (X1-X6) contains a mix of xylooligosaccharides, including xylose (X1), xylobiose (X2), xylotriose (X3), xylotetraose (X4), xylopentaose (X5), and xylohexaose (X6). Lanes 1–17 show the hydrolysis products from Runs 1–17 in the absence or presence of Triton X-100
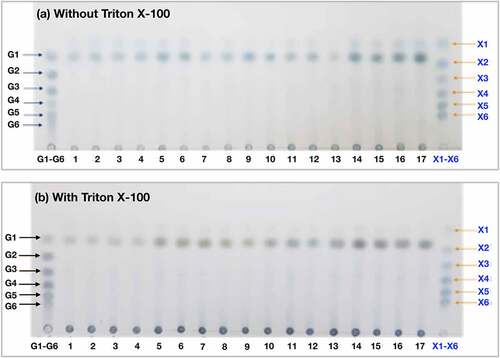
Figure 6. FTIR spectra for untreated rice straw samples with and without Triton X-10 and hydrolyzed untreated rice straw samples with and without Triton X-100 at 24-h incubation. Triton X-100 (0.375 g/g) was added to 5% (w/v) of untreated rice straw alone and the hydrolysis reaction with enzyme loads of 50 FPU/g and 100 XU/g substrates. All samples were incubated in ABS at 55°C for 24 h and then centrifuged to obtain the solids for FTIR analysis
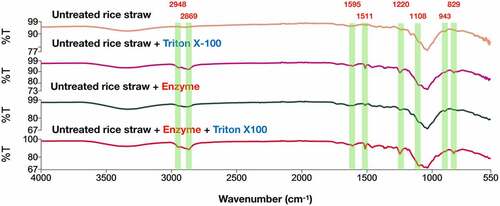
Figure 7. SEM images of (a) untreated rice straw, (b) untreated rice straw with Triton X-100, (c) hydrolyzed rice straw, and (d) hydrolyzed rice straw with Triton X-100 at a magnification of 500-time
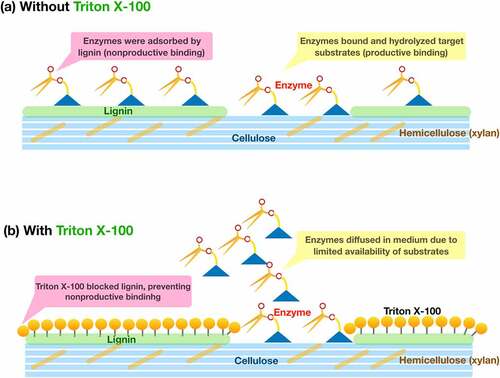
Figure 8. Possible effects of surfactant on enzyme-substrate interaction during hydrolysis of untreated rice straw