
Figures & data
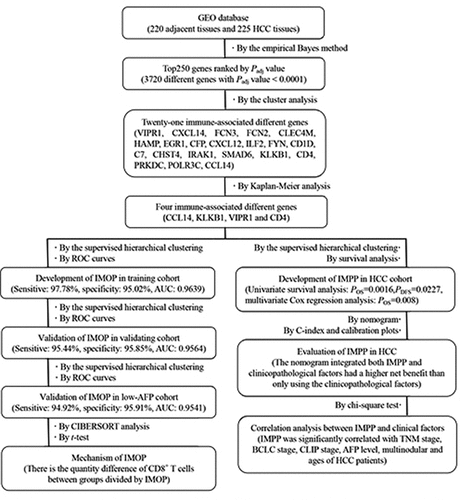
Figure 1. Identification of a differentially expressed immune-associated gene signature for HCC. (a) Volcano plot shows differentially expressed genes based on an absolute log2 fold change (FC) >1.5 and adjusted P value < 0.05; black circles indicate four immune-associated genes. (b) GO analysis of the top 250 differentially expressed genes. (c) Circos plot illustrating the relationship between differentially expressed immune-associated genes and GO terms for HCC. (d) Univariate analysis of the relationship between differentially expressed immune-associated genes and HCC overall survival. (e) Univariate analysis of the relationship between differentially expressed immune-associated genes and HCC disease-free survival
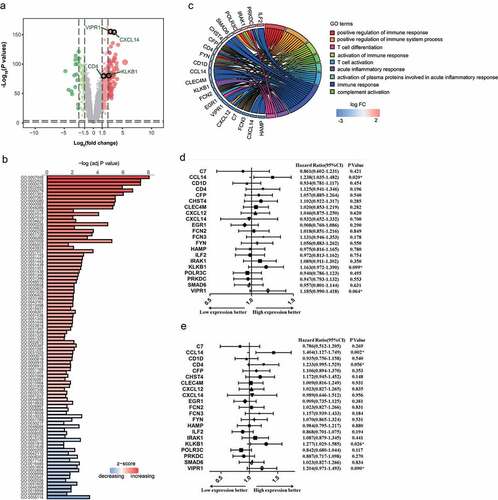
Table 1. Sensitivity and specificity of the immune-associated molecular occurrence predictor in the training cohort, validation cohort, and low-AFP cohort
Figure 2. Development and validation of an IMOP for HCC. (a) Development of the IMOP via hierarchical clustering analysis of the training cohort. (b) ROC validation of IMOP in the training cohort, validation cohort, and low-AFP cohort
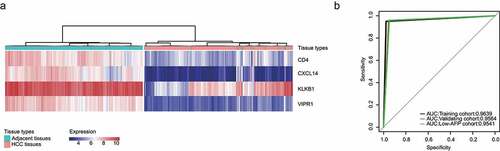
Figure 3. Development and validation of an IMPP for HCC. (a) Development of the IMPP via hierarchical clustering. (b) Overall survival was significantly lower in the immunodeficient group than in the normal immunity group. (c) Disease-free survival was also significantly lower in the immunodeficient group than in the normal immunity group. (d) Nomogram for predicting 5- and 10-year overall survival for HCC patients based on IMPP and clinicopathological characteristics (MN, Multinodular; BCLC, Barcelona Clinic liver cancer; CLIP, Cancer of the Liver Italian Program). (e) Calibration plot illustrating agreement between observed and nomogram-predicted 5- and 10-year outcomes. The 45° dashed line represents perfect prediction; the actual results from our nomogram are indicated by blue and red lines
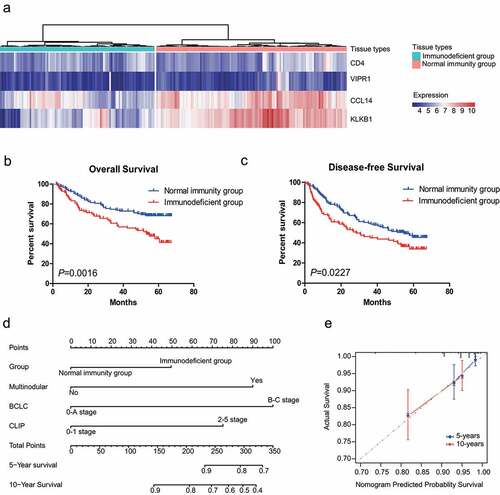
Table 2. Univariate and multivariate Cox regression analyses of disease-free survival and overall survival between HCC patient groups stratified by the immune-associated molecular prognosis predictor
Table 3. Correlation analysis between immune-associated molecular prognosis predictor and the clinicopathological characteristics of HCC patients
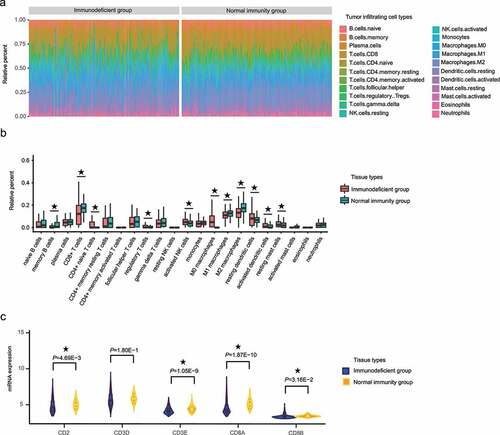
Figure 4. The proportion of CD8+ T cells significantly differed between the HCC IMOP–stratified immunodeficient and normal immunity groups. (a) Stacked bar chart showing the relative distribution immune cells (22 cell types) in each sample. (b) Box plot illustrates relative percent of tumor-infiltrating immune cells between the HCC IMOP–stratified immunodeficient and normal immunity groups. (c) Violin plot shows differential expression of CD8+ T-cell markers between the HCC IMOP–stratified immunodeficient and normal immunity groups
Supplemental Material
Download ()Data availability statement
Data analyzed during the present study are available at NCBI GEO: GSE14520 and GSE36376.