
Figures & data
Figure 1. ScRNA-seq analysis reveals a variety of cell types in PDAC and control pancreas
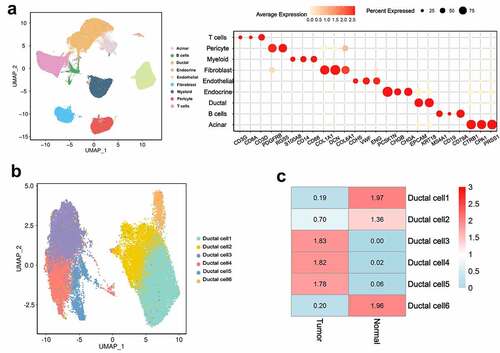
Figure 2. ScRNA-seq analysis reveals the status and invasive trajectory of ductal cells
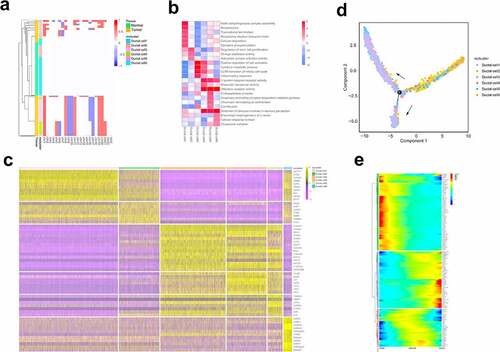
Table 1. Screening of CRGs
Figure 3. Survival and ROC analysis in training and validation datasets
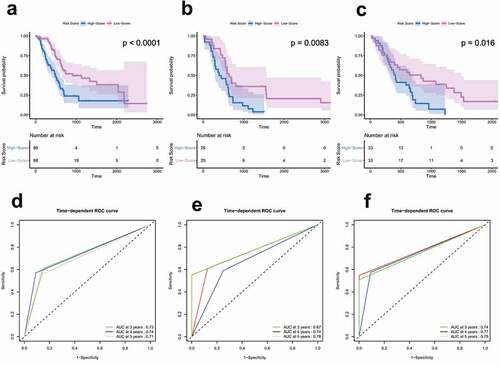
Table 2. Univariate and multivariate survival analysis in the training cohort
Figure 4. Clinical stratification survival analysis
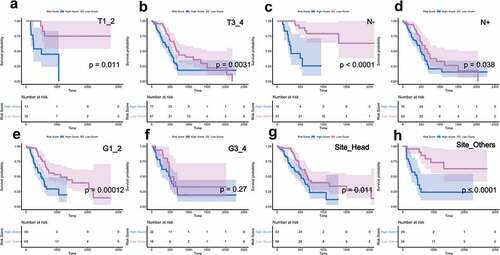
Figure 5. The landscape of somatic mutation burden between different risk groups
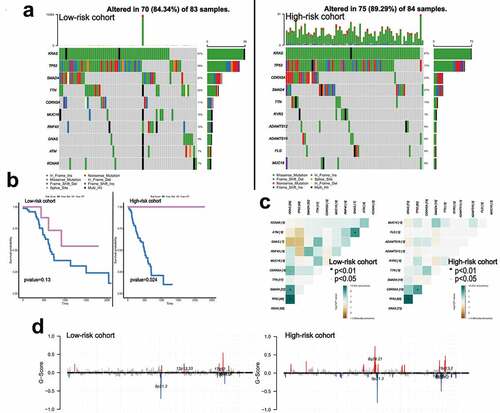
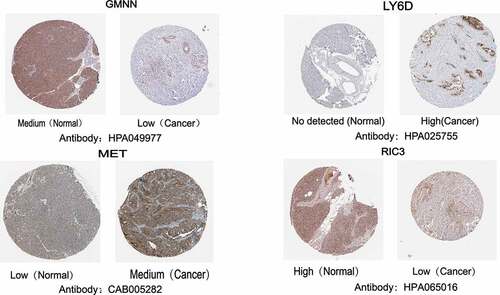
Figure 6. The translational differences of the key genes between pancreatic cancer tissues and normal pancreatic tissues in the HPA database
Data availability statement
The datasets analyzed was acquired from The Cancer Genome Atlas (TCGA) database(https://portal.gdc.cancer.gov/), Gene Expression Omnibus (GEO) database(https://www.ncbi.nlm.nih.gov/geo/) and Biological Project Library(https://bigd.big.ac.cn/bioproject/browse/PRJCA001063).