
Figures & data
Figure 1. The surface characterization of different titanium. The SEM picture of PT group (a) and SLA group (b), and the mean values of the different titanium surfaces (c)
Figure 2. Effect of FSS on the proliferation of MG63 on different titanium implant. Cells were cultured in glass slide (control group), polished treatment titanium surface (PT group), and sandblasted/acid-etched surfaces titanium surface (SLA group). Cells were under static condition (a) and exposed to FSS (8 dynes/cm2 (b), 12 dynes/cm2 (c), 16 dynes/cm2 (d)) for the indicated times. *P < 0.05, **P < 0.01, ***P < 0.001
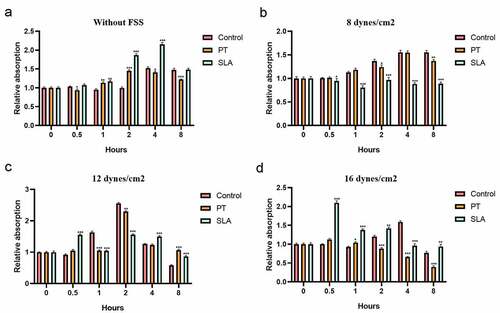
Figure 3. Effect of FSS on the FAK gene expression of MG63 on different titanium implant. Cells were exposed to FSS (8 dynes/cm2 (a), 12 dynes/cm2 (b), 16 dynes/cm2 (c)). *P < 0.05, **P < 0.01, ***P < 0.001
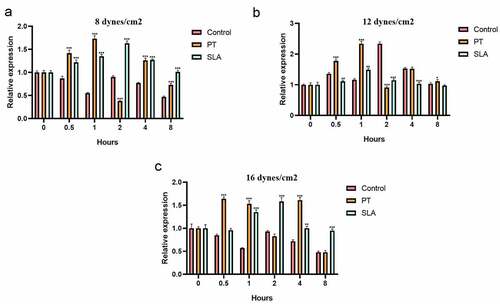
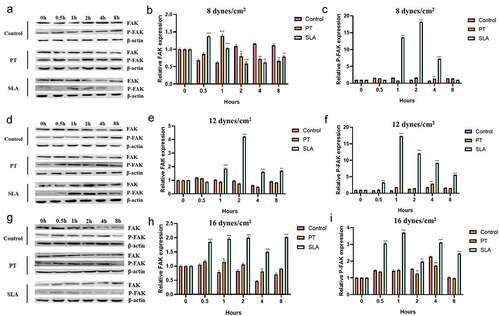
Figure 4. Effect of FSS on the FAK gene expression of MG63 on different titanium implant. Cells were exposed to FSS at 8 dynes/cm2 (a–c), 12 dynes/cm2 (d–f), 16 dynes/cm2 (g–i). The western blot results of FAK and P-FAK in cells exposed to FSS at 8 dynes/cm2 (a), 12 dynes/cm2 (d) and 16 dynes/cm2 (g). The proteins levels FAK were calculated in cells exposed to FSS at 8 dynes/cm2 (b), 12 dynes/cm2 (e) and 16 dynes/cm2 (h). The proteins levels P-FAK were calculated in cells exposed to FSS at 8 dynes/cm2 (c), 12 dynes/cm2 (f) and 16 dynes/cm2 (i). *P < 0.05, **P < 0.01, ***P < 0.001
Data availability statement
The data that support the findings of this study are available from the corresponding author upon reasonable request.