Figures & data
Figure 1. Circ_RANBP9 levels were elevated in patients with polycystic ovary syndrome (PCOS) and in ovarian granulosa cells (GCs). Different levels of circ_RANBP9 were compared in (a) plasma of patients with PCOS (n = 45) and healthy controls (n = 45), as well as (b) normal ovarian epithelium (IOSE80) cells and GCs (KGN, COV434). **P < 0.01
Figure 2. Effects of circ_RANBP9 on proliferation and apoptosis of GCs. (a) circ_RANBP9 levels were tested by RT-qPCR. (b) MTT assay was conducted to determine the proliferation of GCs. (c) Colony formation assay was performed to detect the proliferation of GCs. (d) Flow cytometry was carried out to measure the apoptosis rates of GCs. (e) Protein levels of caspase-3, Bax, and Bcl-2 via western blot analyses were determined post-transfection. **P < 0.01
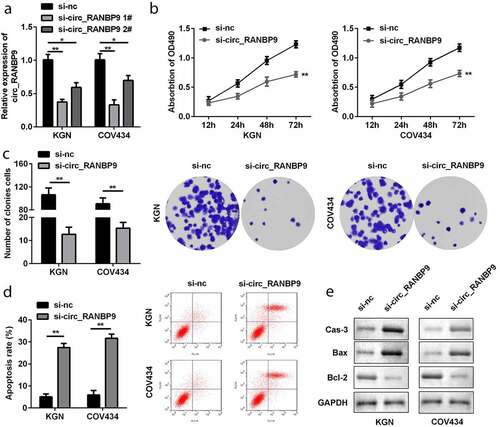
Figure 3. miR-136-5p was negatively regulated by circ_RANBP9. (a) Direct binding sites of miR-136-5p in WT 3ʹ-UTR of circ_RANBP9 and MUT 3ʹ-UTR of circ_RANBP9 were designed. (b) WT circ_RANBP9 or MUT circ_RANBP9 recombinant plasmids and miR-136-5p mimic or mimic nc were co-transfected and luciferase reporter assay was performed. (c) miR-136-5p levels determined using RT-qPCR were detected in GC overexpression or knockdown of circ_RANBP9. (d) Interaction between miR-136-5p and circ_RANBP9 was confirmed by RNA pull-down. (e) Expression of miR-136-5p in normal ovarian epithelium (IOSE80) cells and GCs (KGN, COV434) was detected by RT-qPCR. **P < 0.01. ##P < 0.01
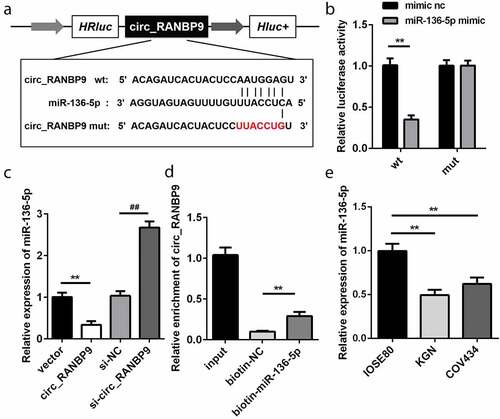
Figure 4. Inhibition of miR-136-5p abolished the effects on proliferation and apoptosis induced by knockdown of circ_RANBP9. (a) Expression of miR-136-5p was tested in transfected cells by RT-qPCR. Cell proliferation was assessed post-transfection by (b) MTT assay and (c) colony formation assay. (d) Flow cytometry was performed to detect apoptosis rates of GCs. (e) Protein levels of caspase-3, Bax, and Bcl-2 at was determined by western blotting. **P < 0.01. ##P < 0.01
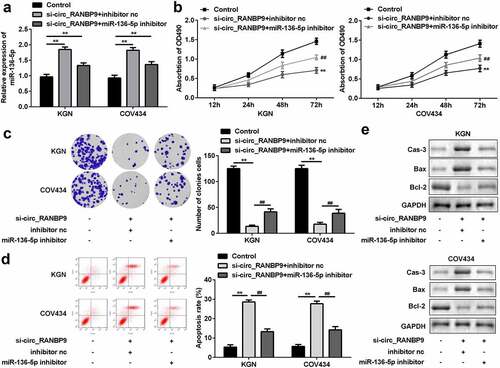
Figure 5. miR-136-5p directly targeted downstream XIAP. (a) Direct binding sites between miR-136-5p and WT 3ʹ-UTR of XIAP are shown. MUT 3ʹ-UTR of circ_RANBP9 was also designed. (b) Luciferase activity was tested in HEK293T cells transfected by WT XIAP or MUT XIAP recombinant plasmids and miR-136-5p mimic or mimic nc. (c) Interaction between XIAP and miR-136-5p was assessed using RNA pull-down assay. (d) XIAP expression was determined by RT-qPCR in overexpression or inhibition of miR-136-5p cells. (e) Comparison of XIAP using RT-qPCR in IOSE80 cells and GCs (KGN, COV434). (f) The expression of XIAP was measured using western blotting. **P < 0.01. ##P < 0.01
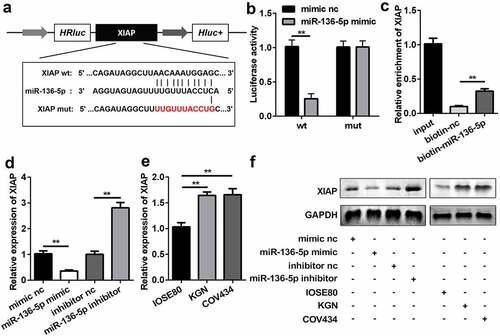
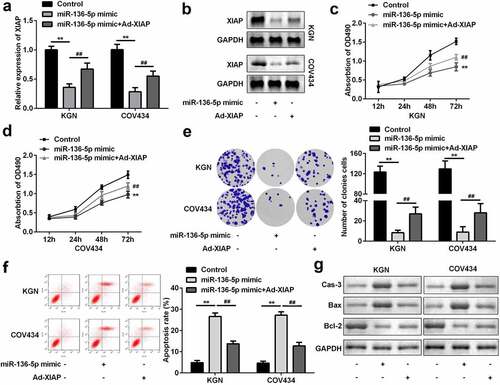
Figure 6. XIAP reversed the effects on proliferation and apoptosis induced by miR-136-5p. (a) XIAP levels were measured by RT-qPCR. (b) XIAP levels were detected by western blotting. Cell proliferation by (c) MTT assay and (d) colony formation assay performed post-transfection is shown. (e) Cell apoptosis was determined by flow cytometry. (f) Protein levels of caspase-3, Bax, and Bcl-2 were determined using western blotting. **P < 0.01. ##P < 0.01