Figures & data
Figure 1. IL-6 decreased the activity and promoted lipid peroxidation of BEAS-2B cells. A. MTT assay detected the cell viability. B. The TBARS production rate was determined by the kit. C. The corresponding kits were used to detect the expression of the indexes related to oxidative stress. *p < 0.05, **p < 0.01, ***p < 0.001 vs Control
Figure 2. IL-6 disrupted iron homeostasis and induced ferroptosis of BEAS-2B cells. A. Iron Assay Kit detected total iron levels in cells. B. Iron Assay Kit detected Fe2+ levels in cells. C. LIP Assay was used to detect the iron expression. D. Western blot detected the expression of ferroptosis-related proteins. *p < 0.05, **p < 0.01, ***p < 0.001 vs Control
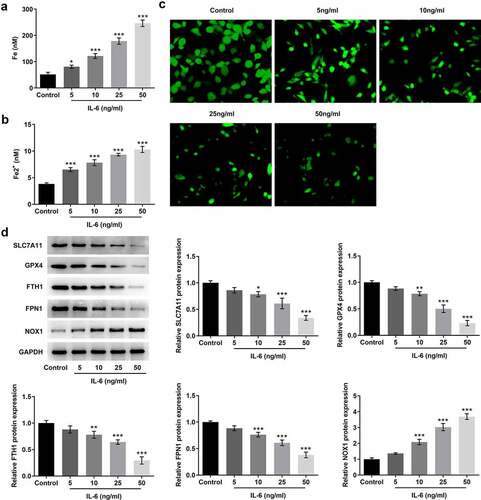
Figure 3. Pretreatment with Fer-1 and NAC partially reversed the effect of IL-6 on lipid peroxidation in BEAS-2B cells, while Fe increased those effects. A. MTT assay detected the cell viability after the induction of Fer-1, Fe and NAC. B. The TBARS production rate was determined by the kit after the induction of Fer-1, Fe and NAC. C. The corresponding kits were used to detect the expression of the indexes related to oxidative stress after the induction of Fer-1, Fe and NAC. ***p < 0.001 vs Control; #p < 0.05, ###p < 0.001 vs IL-6
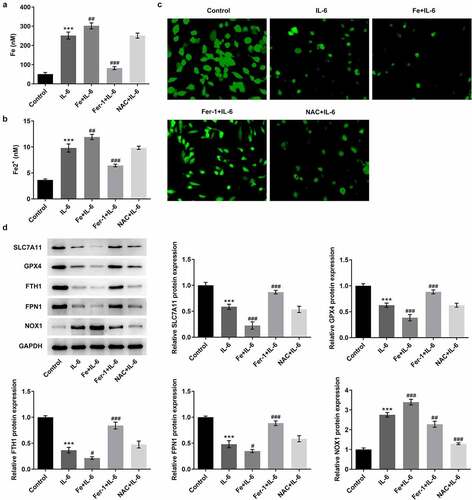
Figure 4. Pretreatment with Fer-1 and NAC partially reversed the effect of IL-6 on ferroptosis in BEAS-2B cells, while Fe increased those effects. A. Iron Assay Kit detected total iron levels in cells after the induction of Fer-1, Fe and NAC. B. Iron Assay Kit detected Fe2+ levels in cells after the induction of Fer-1, Fe and NAC. C. LIP Assay was used to detect the iron expression after the induction of Fer-1, Fe and NAC. D. Western blot detected the expression of ferroptosis-related proteins after the induction of Fer-1, Fe and NAC. ***p < 0.001 vs Control; #p < 0.05, ##p < 0.01, ###p < 0.001 vs IL-6