Figures & data
Table 1. Primer sequences for RT-qPCR
Table 2. A KEGG functional annotation for the differentially expressed genes from GSE101728 and GSE138178
Figure 1. EGR1 is highly expressed in LC samples. a-b, heatmaps for DEGs between LC tissues and healthy tissues in the GEO GSE101728 (a) and GSE138178 (b) datasets; c, an intersection analysis based on the findings in a and b using a Venn diagram; d, expression of EGR1 mRNA in the clinical tumor tissues and the para-cancerous tissues examined by RT-qPCR (n = 43, the paired t test, *p < 0.05); e, expression of EGR1 mRNA in the acquired LC cell lines (Huh-7, HLE, Hep3B and MHCC97-H) and in THLE-3 cells evaluated by RT-qPCR (one-way ANOVA, *p < 0.05)
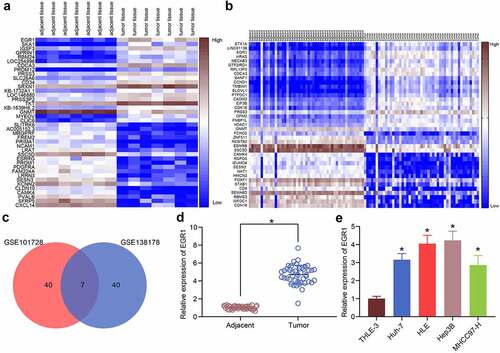
Table 3. Correlation between EGR1 expression with the clinical baseline characteristics of patients with LC
Figure 2. EGR1 serves as a potential biomarker of LC. a-s, levels of liver function-related factors TBIL (a), AST (b) and ALT (c) in the serum of LC patients (median expression of EGR1 = 4.24, *p < 0.05, unpaired t test); d, level of the LC-specific marker protein AFP in the serum of LC patients (median expression of EGR1 = 4.24, *p < 0.05, unpaired t test); e-h, positive correlations between EGR1 and the expression of TBIL (e), AST (f), ALT (g) and AFP (h) (Pearson’s correlation analysis, all *p < 0.05)
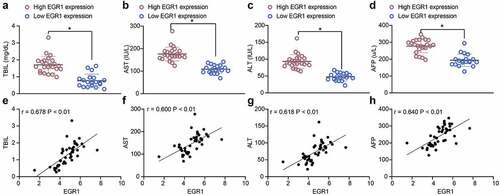
Figure 3. Artificial downregulation of EGR1 reduces viability of LC cells. a, EGR1 expression in HLE and Hep3B cells detected by RT-qPCR (two-way ANOVA, *p < 0.05); b, proliferation of HLE and Hep3B cells determined by colony formation assays (two-way ANOVA, *p < 0.05); c-d, migratory (c) and invasive (d) potentials of HLE and Hep3B cells determined by Transwell assays (two-way ANOVA, *p < 0.05); e, apoptosis of HLE and Hep3B cells evaluated by Hoechst 33,258 staining (two-way ANOVA, *p < 0.05); F, apoptosis rate in HLE and Hep3B cells evaluated by flow cytometry (two-way ANOVA, *p < 0.05)
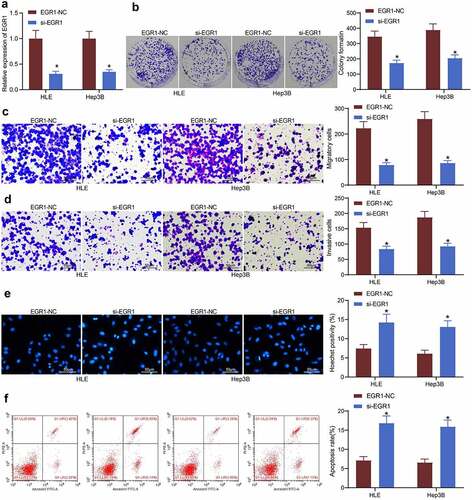
Figure 4. Downregulation of EGR1 reduces LC tumorigenesis in nude mice. a, volume of the xenograft tumors in nude mice (two-way ANOVA, *p < 0.05); b, weight of tumors on the 28th d (two-way ANOVA, *p < 0.05); c, expression of in the tumor tissues detected by immunohistochemical staining (two-way ANOVA, *p < 0.05); d, formation of metastatic nodules in murine lung tissues assessed by HE staining (two-way ANOVA, *p < 0.05)
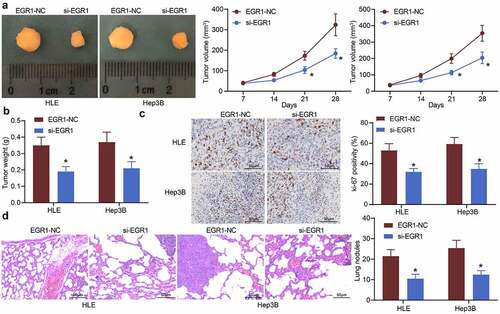
Figure 5. EGR1 transcriptionally activates miR-675 to govern SESN3 expression. a, differentially expressed miRNAs in cells transfected with si-EGR1 determined using a miRNA microarray analysis; b, binding between EGR1 and miR-675 promoter validated via the ChIP-qPCR assay (two-way ANOVA, *p < 0.05); c, a Venn map for the intersection of the predicted mRNA targets of miR-675 and the differentially expressed mRNAs of the two GEO datasets; d, mRNA expression of SESN3 in HLE and Hep3B cells after si-EGR1 transfection examined by RT-qPCR (two-way ANOVA, *p < 0.05); e, binding between miR-675 and SESN3 validated via a luciferase assay (two-way ANOVA, *p < 0.05); f, miR-675 and SESN3 expression in the LC cell lines (Huh-7, HLE, Hep3B and MHCC97-H) and in THLE-3 cells quantified by RT-qPCR (two-way ANOVA, *#p < 0.05); g, expression of miR-675 and SESN3 mRNA in the LC tissues and the para-cancerous tissues examined by RT-qPCR (n = 43, the paired t test)
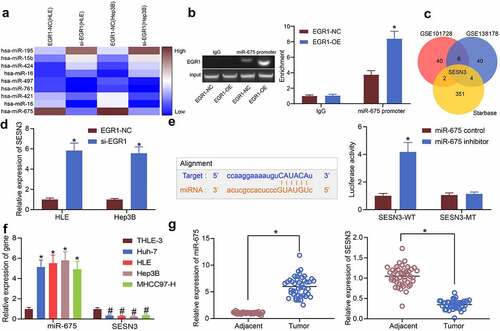
Figure 6. miR-675 and SESN3 are possible biomarkers of LC. a, predictive value of miR-675 in tumor size (a) and TNM staining (b) determined by ROCs (Wilson/Brown analysis, *p< 0.05); c-d, predictive value of SESN3 in tumor size (c) and TNM staining (d) determined by ROC (Wilson/Brown analysis, *p< 0.05); e, interactions among EGR1, miR-675 and SESN3 expression and the levels of TBIL, AST, ALT and AFP in serum of patients analyzed using a multivariate correlation analysis (Pearson’s analysis, *p< 0.05)
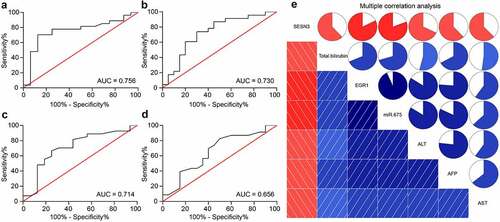
Figure 7. miR-675 and SESN3 affects viability and aggressiveness of LC cells. a, expression of miR-675 and SESN3 mRNA in HLE and Hep3B cells evaluated by RT-qPCR (two-way ANOVA, *p < 0.05); b, proliferation of HLE and Hep3B cells evaluated by colony formation assays (two-way ANOVA, *p < 0.05); c-d, migratory (c) and invasive (d) potentials of HLE and Hep3B cells evaluated by Transwell assays (two-way ANOVA, *p < 0.05); e, apoptosis of HLE and Hep3B cells evaluated by Hoechst 33,258 staining (two-way ANOVA, *p < 0.05); f, volume of the tumors in nude mice (two-way ANOVA, *p < 0.05); g, weight of the tumors on the 28th d (two-way ANOVA, *p < 0.05)
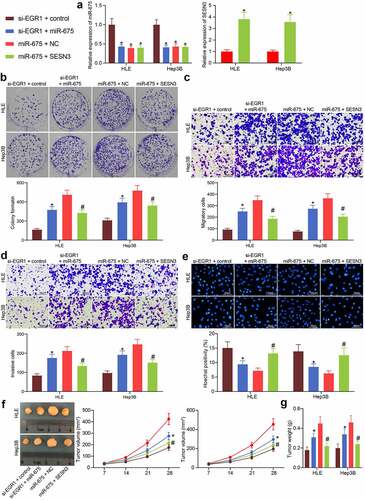
Figure 8. The EGR1/miR-675/SESN3 axis mediates the Wnt/β-catenin pathway. a-b, abnormally activated signaling pathways in LC analyzed by KEGG pathway analyses based on the genes screened using the GSE101728 (a) and GSE138178 (b) datasets, and the top 10 pathways were presented (* p < 0.05, Fisher’s exact test); c, a Venn map for the intersected pathways in panels a and b; d, a KEGG enrichment analysis based on the targeting genes of miR-675, and the top 10 pathways were presented (Fisher’s exact test, *p < 0.05); e-f, protein levels of β-catenin and c-myc in HLE (e) and Hep3B (f) cells examined by western blot analysis (two-way ANOVA, *p < 0.05 vs. EGR1-NC, #p < 0.05 vs. si-EGR1 + miR-675, &p < 0.05 vs miR-675+ SESN3)
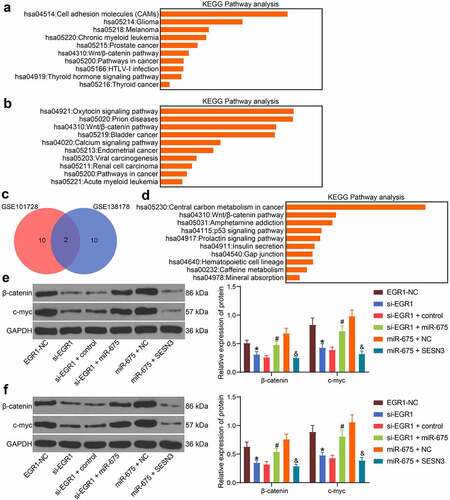
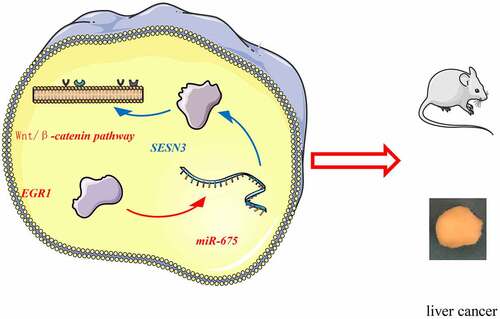
Figure 9. A graphical abstract for the study. In LC, EGR1 is upregulated, which binds to the miR-675 promoter to activate its transcription. miR-675 targets SESN3 mRNA to reduce its expression, which leads to activation of the Wnt/β-catenin and tumor development