Figures & data
Figure 1. miR-337-5p expression is upregulated in cardiomyocytes subjected to Ang II treatment. (a) The morphology and size of cardiomyocytes subjected to Ang II treatment were evaluated by immunofluorescence staining of α-actin (n = 6). (b, c) The levels of myocardial hypertrophy biomarkers ANP, BNP, and β-MHC were detected using qPCR (n = 3). (d) The expression of miR-337-5p was detected with qPCR (n = 3). **p < 0.01
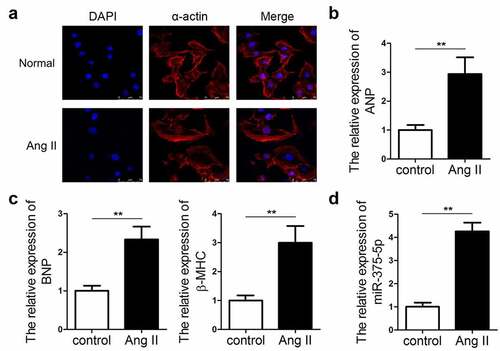
Figure 2. miR-337-5p expression knockdown ameliorates the Ang II–induced cardiomyocyte hypertrophy. (a) miR-337-5p expression was downregulated in cardiomyocytes subjected to anti-miR-337-5p treatment (n = 3). (b) The morphology and size of cardiomyocyte were detected by immunofluorescence staining of α-actin (n = 6). (c) The levels of myocardial hypertrophy biomarkers ANP, BNP, and β-MHC were detected using qPCR (n = 3). **p < 0.01
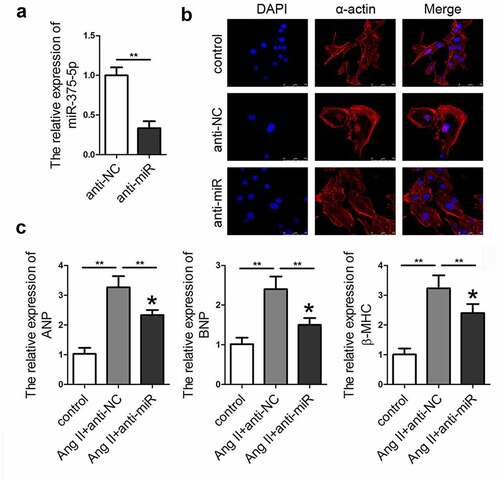
Figure 3. miR-337-5p directly targets UBQLN1 in cardiomyocytes. (a, b) The wild-type and mutant binding sites of miR-337-5p at the 3ʹ-UTR of UBQLN1 are shown. (c) Luciferase activity assay was performed to identify whether UBQLN1 is the direct target gene of miR-337-5p. (d) qPCR was performed to evaluate UBQLN1 expression. (e, f) Western blot analysis was conducted to evaluate the protein expression of UBQLN1 (n = 3). **p < 0.01
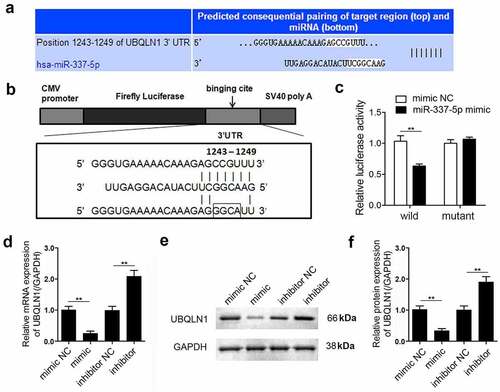
Figure 4. miR-337-5p regulates the expression of UBQLN1 and the downstream proteins. (a, b) Western blot assay was carried out to evaluate the expression levels of UBQLN1, mTOR, p-mTOR, p70s6k, and p-p70s6k (n = 3). *p < 0.05, **p < 0.01
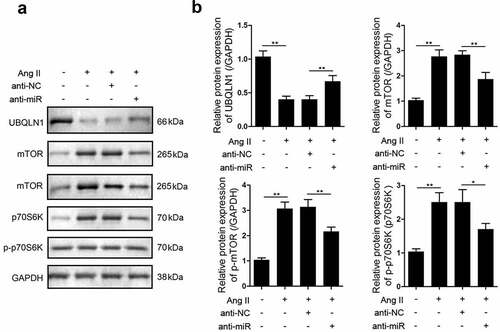
Figure 5. UBQLN1 knockdown reverses the effect of miR-337-5p silencing on cardiomyocyte hypertrophy. (a) The expression level of UBQLN1 was evaluated by qPCR (n = 3). (b) The morphology and size of cardiomyocyte were evaluated by immunofluorescence staining of α-actin (n = 3). (c) The levels of myocardial hypertrophy biomarkers ANP, BNP, and β-MHC were detected using qPCR (n = 3). **p < 0.01
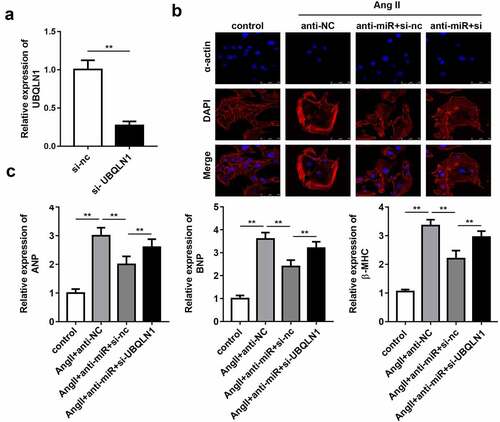
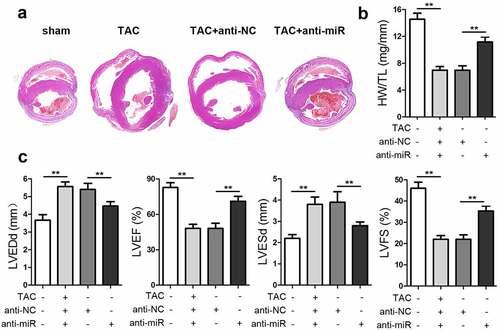
Figure 6. miR-337-5p silencing inhibits cardiac hypertrophy in vivo. (a) HE staining of the heart tissue was performed to analyze cardiac hypertrophy. (b) The ratio of heart weight to tibial length (HW/TL) was calculated. (c) Cardiac function was evaluated by assessing LVEF, LVFS, LVEDd, and LVESd. **p < 0.01