
Figures & data
Figure 1. The relationship between the FTO expression and the m6A RNA methylation. (a). the m6A RNA methylation level was detected by dot plot assay and it was elevated in BCa tissues compared to that in the ANTs. (b-c). the FTO expression was up-regulated in BCa group according to the results of RT-qPCR and western blotting (d). determination of the FTO expression in BCa tissues and ANTs by IHC (scale bar, 100 µm; magnification, 200×), showing that the FTO expression increased in BCa tissues compared with that in ANTs. (e) the prognostic effect of FTO expression on overall survival rate of BCa patients determined using the kaplan-meier method, indicating that FTO could be advantageous to prolong overall survival of BCa patients. BCa: bladder cancer; ANTs: adjacent normal tissues. all the data are presented as mean ± standard error of the mean. ‘*’ represents P < 0.05
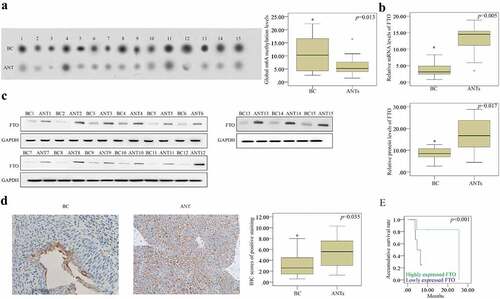
Figure 2. The tumor-suppressive effects of FTO on BCa cells. (a-b). The FTO expression was up-regulated following transfection with FTO plasmid in BCa cell lines by RT-qPCR and western blotting. (c). MTT analysis showed that overexpression of FTO could inhibit cell viability of BCa cells. (d). Transwell invasion analysis showed that the capability of invasion was reduced after transfection with FTO plasmid. (e). overexpression of FTO could enhance the apoptosis of BCa cells by flow cytometry. all the data are presented as mean ± standard error of the mean. ‘*’ represents P < 0.05
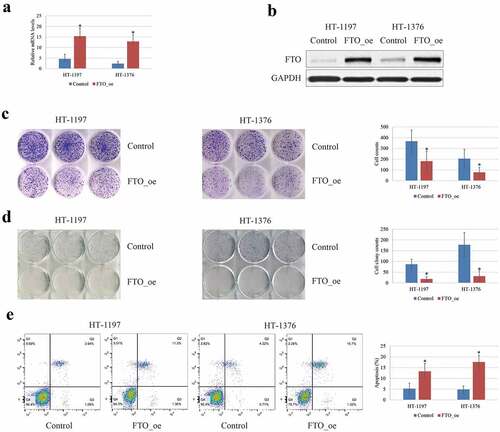
Figure 3. Knockdown of SFPQ alleviated the effects of FTO overexpression on m6A RNA methylatio in BC cells. (a-b). RIP-qPCR analysis showed that the proportion of SFPQ was substantially different between 5/3ʹUTRs of MALAT1, NOTCH1, CSNK2A2, and ITGA6genes. RIP-qPCR showed that the enrichment of SFPQ was extremely low in sites where the remarkably dynamic changes of m6A methylation appeared after FTO transfection. (c-d). FTO_oe: FTO over-expression; siSFPQ: SFPQ knockdown. All the data are presented as mean ± standard error of the mean. ‘*’ represents P < 0.05 compared to control group, and ‘+’ denotes P < 0.05 compared to FTO_oe group. (e-f). The changes of m6A at 5ʹ UTR of MALAT1 and NOTCH1 transcripts, and at 3ʹ UTR of CSNK2A2 and ITGA6 transcripts in HT-1197 (left) and HT-1376 (right) cells with overexpression of FTO and knockdown of SFPQ, indicating that enrichments of m6A-specific antibody were all reduced on the transcripts of these genes in BCa cells with overexpression of FTO compared to negative controls. (g-h). The MALAT1, NOCH1 mRNA and protein levels in BCa cells were down-regulated after transfection with FTO plasmid, while they were up-regulated after combination with SFPQ siRNA. The CSNK2A2, ITGA6 mRNA and protein in BCa cells were up-regulated after transfection with FTO plasmid, while they were down-regulated after combination with SFPQ siRNA
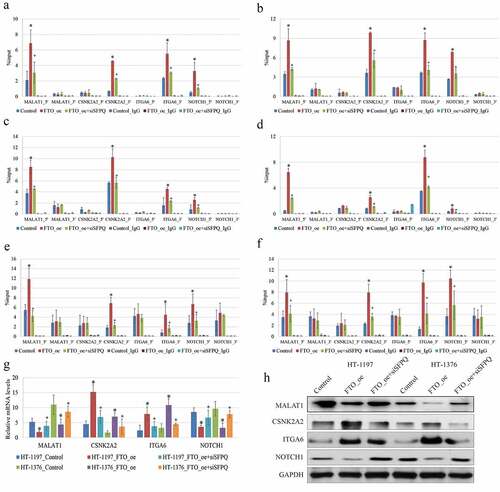
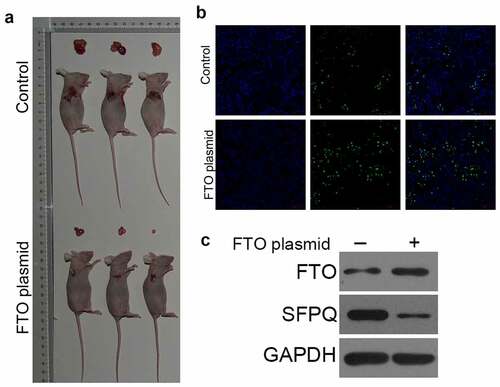
Figure 4. Over-expression of FTO could inhibit the growth of BC cells in vivo A. tumor xenograft mouse model showed that the tumor volume was significantly reduced in mice treated with FTO plasmid. B. tunel was used to determine cell apoptosis, showed that FTO plasmid enhanced cell apoptosis. C. western blot analyzed the expression of FTO and SFPQ
Data Availability Statement
The data that support the findings of this study are available from the corresponding author on a reasonable request.