
Figures & data
Table 1. TCGA datasets evaluated (data from TCGA datasets)
Figure 1. The correlation between ZFC3H1 expression levels and overall survival of patients with PRAD. A, ZFC3H1 expression profile across all tumor samples and paired normal tissues. B, The expression level of ZFC3H1 in PRAD tissues and adjacent non-tumor tissues. C, The overall survival of human PRAD patients in relation with high or low expression levels of ZFC3H1. D. Immunohistochemical staining examined the expression of ZFC3H1 in 10 prostate cancer specimens and paracancerous.
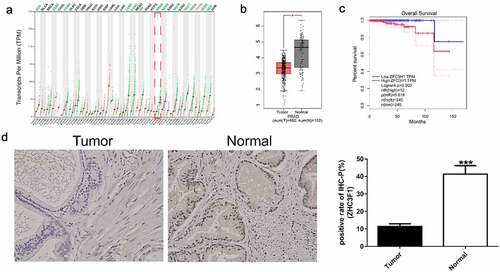
Table 2. Prognosis adenocarcinoma-associated genes identified in The cancer genome atlas using four databases (data from TCGA datasets)
Figure 2. Venn diagram of predicted target genes from three databases
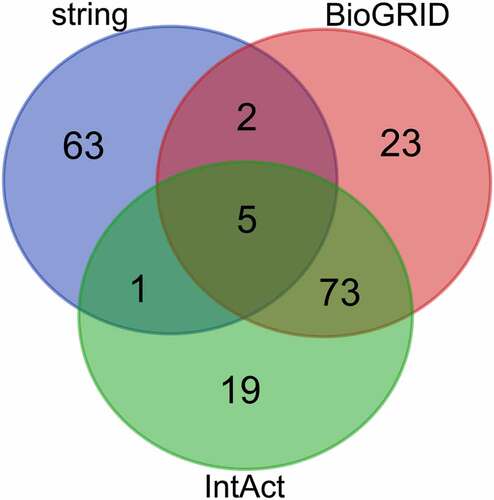
Table 3. Pathway enrichment analysis of overlapping target genes (data from TCGA datasets)
Figure 3. Protein-protein interaction network of overlapping target genes
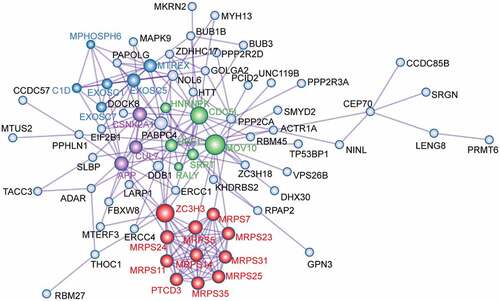
Figure 4. The correlation between selected gene expression levels and overall survival of PRAD patients. A, The expression level of selected genes in PRAD tissues and adjacent non-tumor tissues. B, The overall survival of human patients with PRAD in relation to high or low expression levels of MPHOSPH6 and MRPS31
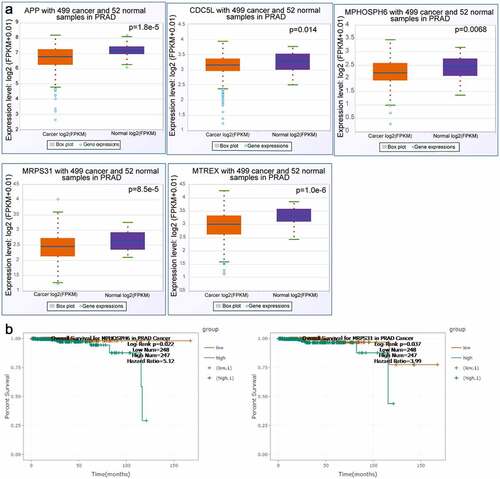
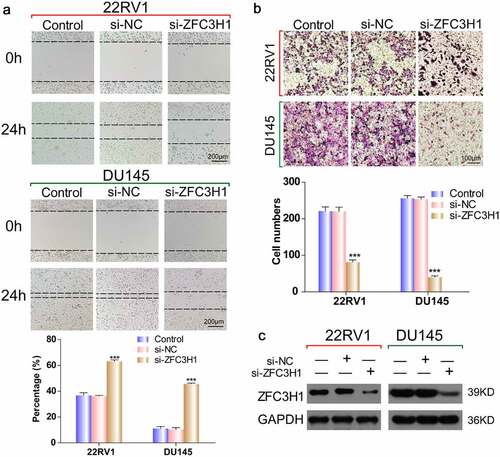
Figure 5. ZFC3H1 knockdown reduced PRAD cell invasive and migration capability. (a) Wound healing assay to determine the cell migration ability following transfection with the ZFC3H1 siRNA or negative siRNA. (b) Transwell assay showing the number of invaded cells following transfection with ZFC3H1 siRNA or negative siRNA. ***P < 0.001. (c) Western blotting showing the interference efficiency of ZFC3H1 siRNA
Supplemental Material
Download ()Availability of Data and Materials
The datasets used and/or analyzed during the current study are available from the corresponding author upon reasonable request.