
Figures & data
Figure 1. Comparison of cardiac dysfunction related index in MI/R group and sham group. (a) Pathological injury was measured by HE staining (×200). (b) MAP value. (c) LVSP value. (d) HR value. (e) The content of MDA. (f) The content of GSH. (g) The content of SOD. (h) Relative expression of miR-148 in MI/R group and sham group was measured by qPCR. The data is shown as means ± SD, **P < 0.01 vs. Sham group
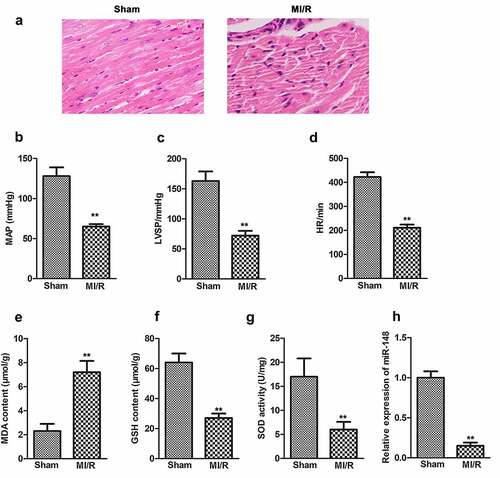
Figure 2. Overexpression of miR-148 alleviates cardiac dysfunction induced by MI/R in immature rats. (a) Relative expression of miR-148 was measured by qPCR. (b) Pathological injury was measured by HE staining (×200) and the Masson staining (×200). (c) MAP value. (d) LVSP value. (e) HR value. (f) The content of CK-MB. (g) The content of cTn1. (h) The content of Mb. (i) The content of MDA. (j) The content of GSH. (k) The content of SOD. The data is shown as means ± SD, **P < 0.01 vs. Sham + agomir-NC group, #P < 0.05 vs. MI/R + agomir-NC group, and ns means no significant difference
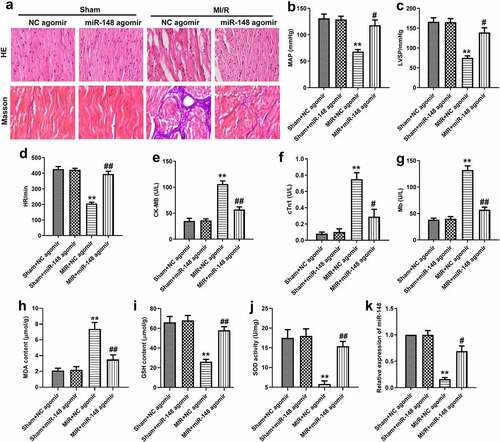
Figure 3. Overexpression of miR-148 alleviated immune disorder caused by MI/R. (a-b) CD4+iNOS+ and CD4+IL-10+ cells in peripheral blood were sorted by flow cytometry. (c) Relative expression of IL-10 was measured by qPCR. (d) Relative expression of iNOS was measured by qPCR. (e-f) Relative protein levels of iNOS and IL-10 were measured by Western Blot. (g) The level of iNOS was measured by ELISA. (h) The level of IL-10 was measured by ELISA. The data is shown as means ± SD, **P < 0.01 vs. Sham + agomir-NC group, #P < 0.05 vs. MI/R + agomir-NC group, and ns means no significant difference
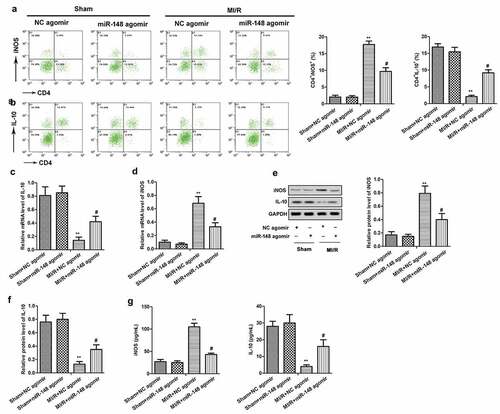
Figure 4. Overexpression of miR-148 alleviates cardiomyocyte apoptosis induced by MI/R (a) Cell apoptosis was measured by TUNEL. (b) Relative protein levels of Bcl-2 and Bax were measured by Western Blot. The data is shown as means ± SD, **P < 0.01 vs. Sham + agomir-NC group, #P < 0.05 vs. MI/R + agomir-NC group, and ns means no significant difference
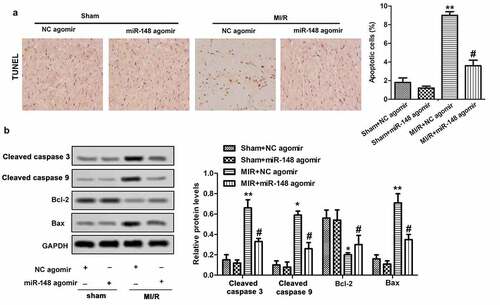
Figure 5. MiR-148 targets PDK4 gene. (a) Potential target sites for miR-148 and PDK4. (b) Relative expression of miR-148 in HEK-293 T cells transfected with miR-148 agomir or agomir-NC. **P < 0.01 vs. Control group (c) Relative expression of miR-148 in HEK-293 T cells transfected with miR-148 inhibitor or Inhibitor-NC. **P < 0.01 vs. Control group (d-e) Relative luciferase activity in HEK-293 T cells was measured by dual luciferase reporter assay. *P < 0.05, **P < 0.01 vs. PDK-WT + agomir-NC group or DK-WT + inhibitor-NC group (f) The targeting relations of PDK4 and miR‐148 were confirmed by RNA pull‐down assay. Endogenous PDK4 was enriched specifically in miR‐148 probe detection compared with control group. (g)Relative expression of PDK4 in HEK-293 T cells transfected with siPDK4 or siNC was measured by RT-qPCR. **P < 0.01 vs. Control group (h) Relative protein level of PDK4 in HEK-293 T cells transfected with si-PDK4 or/and miR-148 inhibitor was measured by Western Blot. (i) Correlation analysis about the expressions of PDK4 and miR-148. The data is shown as means ± SD, *P < 0.05, **P < 0.01 vs. Control group, #P < 0.05 vs. Ad-PDK4 group, and ns means no significant difference
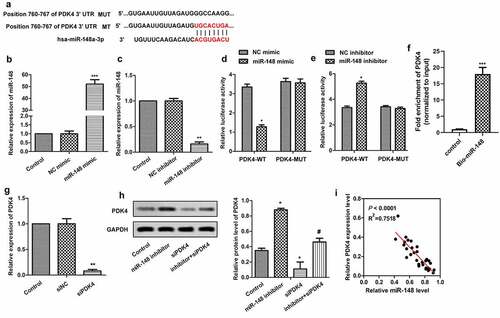
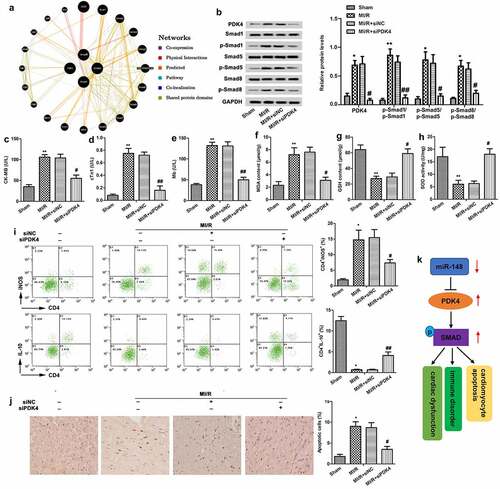
Figure 6. Protective effect of down-regulated PDK4 on cardiac dysfunction. Immature rats with MI/R injury were transfected with siNC or siPDK4 or left untreated as the model control. (a) The gene network diagram obtained from GeneMania showed the various genes within the SMAD pathway that are affected by PDK4. (b) Protein levels of SMAD pathway related p-smad1/smad1, p-smad5/smad5 and p-smad8/smad8 were detected through western blot. (c) CK-MB value. (d) cTn1 value. (e) Mb value. (f) The content of MDA. (g) The content of GSH. (h) The content of SOD. (i) CD4+iNOS+ and CD4+IL-10+ cells in peripheral blood were sorted by flow cytometry. (j) Cell apoptosis was measured by TUNEL staining. (k) The graphical abstract showed that miR-148 regulated the cardiac dysfunction, immune disorders and myocardial apoptosis by targeting PDK4 via the SMAD pathway. The data is shown as means ± SD, *P < 0.05, **P < 0.01 vs. control group, #P < 0.05 vs. MI/R + Ad-PDK4 group, and ns means no significant difference
Data Availability Statements
The datasets used and/or analyzed during the current study are available from the corresponding author on reasonable request.