
Figures & data
Table 1. Primer sequences for quantitative real-time RNA
Figure 1. Effect of histamine, and AS-IV on cell viability of nasal epithelial cells. Chemical structure of AS-IV (a). Effect of histamine on cell viability of nasal epithelial cells (b). Effect of AS-IV on cell viability of nasal epithelial cells (c). Effect of His + AS-IV on cell viability of nasal epithelial cells (d). The results were expressed as the mean ± SD of three independent experiments
Figure 2. AS-IV inhibited His-evoked inflammatory cytokine production in nasal epithelial cells. The levels of IL-6 (a), IL-8 (b), MCP-1 (c), IL-1β (d), GM-CSF (e), and eotaxin (f) were assayed by ELISA. The results were expressed as the mean ± SD of three independent experiments. #P < 0.01 vs. control group, *P < 0.01 vs. His group
Figure 3. AS-IV suppressed His-evoked MUC5AC overproduction in nasal epithelial cells. The contents of MUC5AC were assayed using ELISA. The results were expressed as the mean ± SD of three independent experiments. #P < 0.01 vs. control group, *P < 0.01 vs. His group
Figure 4. Volcano plot showing DEGs between two groups (A, B, and C). Green, gray, and red dots in the Volcano plot showed significantly downregulated genes, insignificantly DEGs, upregulated genes, respectively. The DEGs with fold change ≥ 2.0 and p < 0.05 and are shown
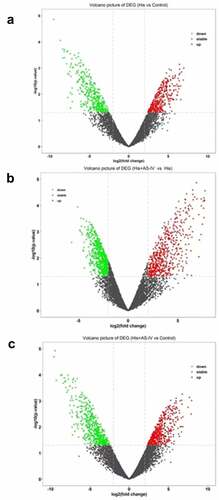
Figure 5. Heatmap diagram indicating that the common DEGs in the three groups (a). Red and yellow squares in the heatmap showed mRNAs with up-regulated and down-regulated expression levels, respectively. KEGG pathway analyses of the overlapping genes (b)
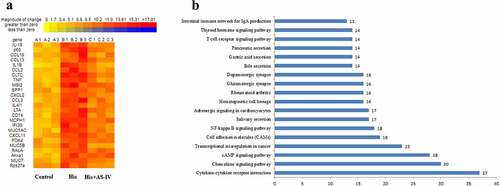
Figure 6. Enrichment pathway of KEGG in NF-KAPPA B signaling pathway
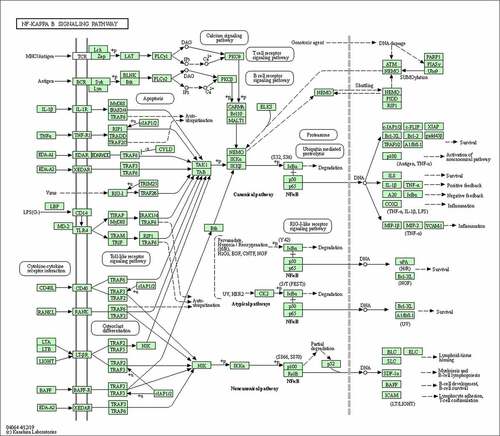
Figure 7. Validation of RNA-SEQ results using quantitative real-time polymerase chain reaction (qRT-PCR) analysis. The results were expressed as the mean ± SD of three independent experiments. #P < 0.01 vs. control group, *P < 0.01 vs. His group
Figure 8. Suppression of the NF-κB signaling pathway decreased His-evoked inflammatory cytokine response in nasal epithelial cells. The effect of NF-κB inhibitor (NF-κBi) on His-evoked secretion of IL-6, IL-8, MCP-1, IL-1β, GM-CSF, and eotaxin (a). The effect of NF-κBi on His-evoked mRNA expression of IL-6, IL-8, MCP-1, and IL-1β (b). The results were expressed as the mean ± SD of three independent experiments. #P < 0.01 vs. control group, *P < 0.01 vs. His group
Data Availability Statement
The datasets generated for this study are available on request to the corresponding author.