
Figures & data
Table 1. Subjects’ basic clinical information
Figure 1. The expression of LUCAT1 was reduced in the AMI patients compared to control individuals. ***P < 0.001
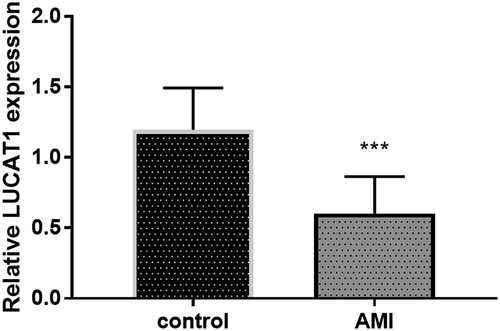
Figure 2. The impacts of LUCAT1 on H2O2-treated cells. (a) The transfection of p-LUCAT1 reversed the decreased LUCAT1 expression steered by H2O2 and the knockdown of LUCAT1 improved the function of H2O2. (b) The overexpression of LUCAT1 reversed the abnormally decreased SOD levels caused by H2O2, while the underexpression of LUCAT1 increased SOD levels caused by H2O2. (c) ROS levels were increased in the H2O2 group, which was further inhibited in the H2O2 + p-LUCAT1 group and improved in the H2O2 + si-LUCAT1 group. (d) The upregulation of LUCAT1 repressed the enhancement of MDA levels in the H2O2-treated cells and the downregulation of LUCAT1 promoted the enhancement of MDA levels. ***P < 0.001, compared with control group; ##P < 0.01, ###P < 0.001, compared with H2O2 group
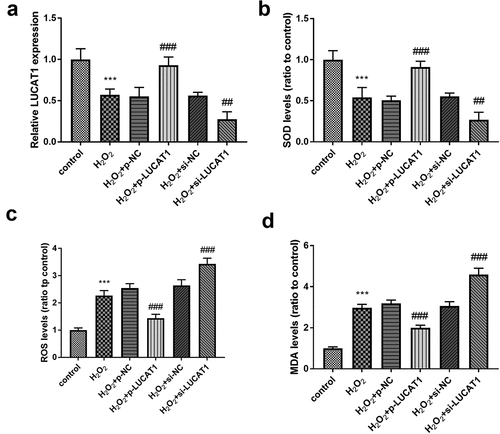
Figure 3. H2O2 led to the increased concentration of (a) TNF-α, (b) IL-6, and (c) IL-1β. Interference of LUCAT1 improved these trends, but LUCAT1 exerted inhibited functions on the secretion. ***P < 0.001, compared with control group; ###P < 0.001, compared with H2O2 group
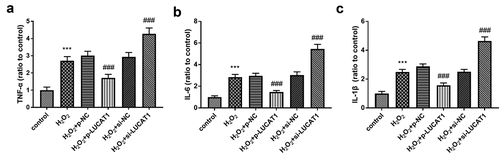
Figure 4. The function of LUCAT1 on cell viability and apoptosis. (a) The cell viability was suppressed in the H2O2 group, while overexpression of LUCAT1 reversed this trend and silenced LUCAT1 facilitated this trend. (b) The treatment of H2O2 facilitate the cell apoptosis, while increased expression of LUCAT1 meliorated this impact and decreased expression of LUCAT1 improved this impact. ***P < 0.001, compared with control group; ##P < 0.01, ###P < 0.001, compared with H2O2 group
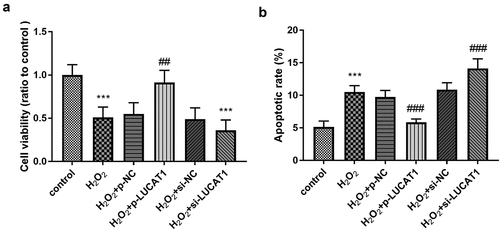
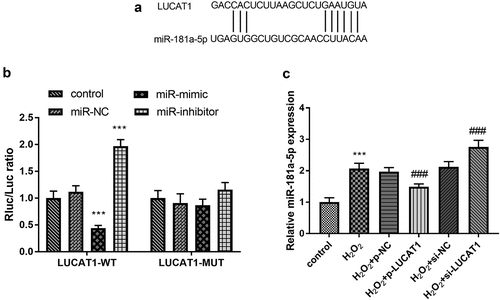
Figure 5. (a) The predictive binding sites between LUCAT1 and miR-181a-5p. (b) Overexpression of LUCAT1 inhibited the luciferase activity and underexpression of LUCAT1 elevated the luciferase activity in the LUCAT1-WT group. (c) Overexpression of LUCAT1 abrogated the upregulation of miR-181a-5p in the H2O2 group and inhibited expression of LUCAT1 accelerated the upregulation of miR-181a-5p in the H2O2 group. ***P < 0.001, compared with control group; ###P < 0.001, compared with H2O2 group
Data Availability Statement
The data that support the findings of this study are available from the corresponding author upon reasonable request.