
Figures & data
Figure 1. Bioinformatics analysis identified that miR-119a-3p and AGR2 were associated with LUAD.(a) Five downregulated miRNAs in LUAD samples were screened from GSE68951 with adj.P value <0.05 and log2FC <-1. (b-f) The expression of five downregulated miRNAs in our collected LUAD samples was detected by qRT-PCR. (g) 30 genes were overlapped from GSE118370 and starBase. GSE118370 was a mRNA expression profile to select the upregulate genes in LUAD samples with adj.P value <0.05 and log2FC >1. starBase was used to predict the target genes of miR-199a-3p. (h) The regulation of growth was a key biological process by Metascape analysis. Bar graph of enriched terms colored by different biological process (left) and p-values (right). (i) The expression of four genes (STK11, SGPL1, NET1 and AGR2) associated with regulation of growth in LUAD samples based on GEPIA data. Red, tumor group. Gray, normal group. *, P < 0.01. (j) The prognosis of NET1 and AGR2 in LUAD was analyzed by GEPIA database
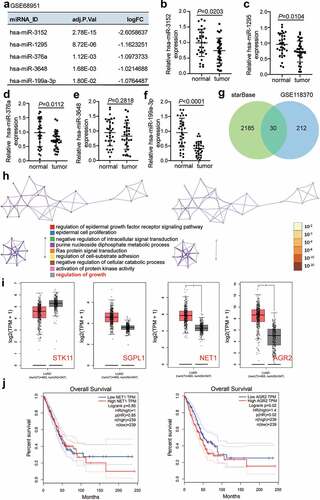
Figure 2. MiR-199a-3p inhibited cell proliferation and adhesion, and enhanced cell apoptosis in LUAD.(a) RT-qPCR detection of miR-199a-3p expression in LUAD cells lines (A549, H1975, PC9, and Calu-3) and normal esophageal epithelial cell (BEAS-2B). (b) Measurement of miR-199a-3p expression in PC9 and Calu-3 cells transfected with mimic-NC, and miR-199a-3p mimic, inhibitor NC, and miR-199a-3p inhibitor by RT-qPCR. (c) Cell viability was detected in PC9 and Calu-3 cells transfected with mimic-NC, and miR-199a-3p mimic, inhibitor NC, and miR-199a-3p inhibitor by CCK-8 assay. (d) Cell proliferation was detected in PC9 and Calu-3 cells transfected with mimic-NC, and miR-199a-3p mimic, inhibitor NC, and miR-199a-3p inhibitor. (e) Cell adhesion was detected in PC9 and Calu-3 cells transfected with mimic-NC, and miR-199a-3p mimic, inhibitor NC, and miR-199a-3p inhibitor. (f) Cell apoptosis rate was detected in PC9 and Calu-3 cells transfected with mimic-NC, and miR-199a-3p mimic, inhibitor NC, and miR-199a-3p inhibitor. Data are presented as mean ± SD of at least three independent tests per experiment
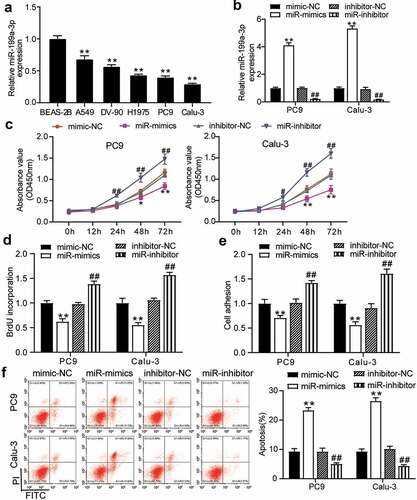
Figure 3. miR-199a-3p inhibited tumor growth in vivo.(a) Representative images of tumor growth in NC and miR-199a-3p agomir group. (b) Tumor weight in NC and miR-199a-3p agomir group was counted. (c) The expression of miR-199a-3p in tumor tissues with the transfection of NC or miR-199a-3p agomir was detected by qRT-PCR. NC: Negative control
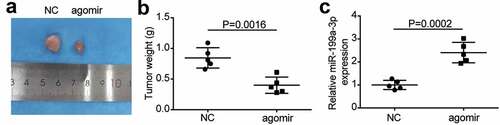
Figure 4. AGR2 was a target of miR-199a-3p.(a) starBase showed the predicted binding sequence of AGR2 3ʹ-UTR. (b) Dual luciferase assay was performed in LUAD cells co-transfected with plasmids AGR2-WT or AGR2-MUT and miR-NC or miR-199a-3p mimic in PC9 and Calu-3 cells. (c) RNA pull-down assay identified that the AGR2 expression was pulled down by miR-199a-3p. (d) RT-qPCR detection of expression of AGR2 in the LUAD tumor tissues. (e) Correlation analysis between the miR-199a-3p expression and AGR2 expression in the LUAD tumor tissues. Data are presented as mean ± SD of at least three independent tests per experiment
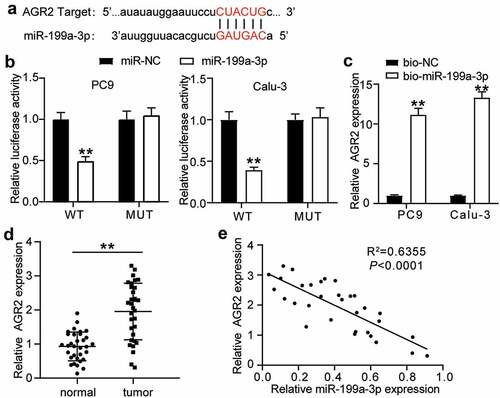
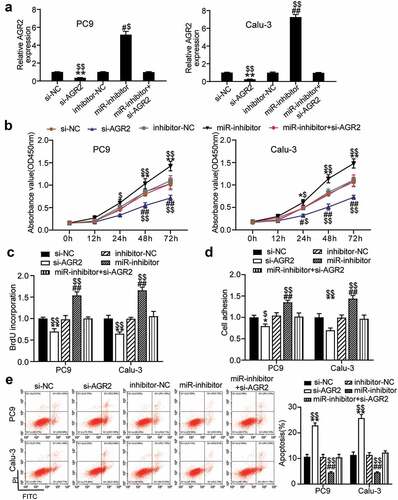
Figure 5. MiR-199a-3p targeting AGR2 regulated cell proliferation and apoptosis in LUAD.(a) Measurement of AGR2 protein expression in PC9 and Calu-3 cells transfected with Si- NC, Si-AGR2, inhibitor-NC, miR-199a-3p inhibitor, and Si-AGR2+ miR-199a-3p inhibitor by western blot. (b) Cell viability was detected in PC9 and Calu-3 cells transfected with Si- NC, Si-AGR2, inhibitor-NC, miR-199a-3p inhibitor, and Si-AGR2+ miR-199a-3p inhibitor by CCK-8 assay. (c) Cell proliferation was detected in PC9 and Calu-3 cells transfected with Si- NC, Si-AGR2, inhibitor-NC, miR-199a-3p inhibitor, and Si-AGR2+ miR-199a-3p inhibitor by BrdU assay. (d) Cell adhesion level was determined in PC9 and Calu-3 cells transfected with Si- NC, Si-AGR2, inhibitor-NC, miR-199a-3p inhibitor, and Si-AGR2+ miR-199a-3p inhibitor. (e) Cell apoptosis was determined in PC9 and Calu-3 cells transfected with Si- NC, Si-AGR2, inhibitor-NC, miR-199a-3p inhibitor, and Si-AGR2+ miR-199a-3p inhibitor by FITC apoptosis detection kit. Data are presented as mean± SD of at least three independent tests per experiment
Supplemental Material
Download ()Data availability
The datasets used and/or analyzed during the current study are available from the corresponding author on reasonable request.