
Figures & data
Table 1. Demographic distribution of GDI1 in a pooled dataset of colon cancer
Table 2. Uni- and multivariate analysis for GDI1 and survival in CRC datasets
Table 3. Demographic distribution of colorectal cancers from ZJU set
Figure 1. Distribution of the GDI1 mRNA expression and aggressiveness of CRC
Patients’ gene expression profiles were downloaded. a) The mRNA expression of GDI1 and AJCC TNM stages of CRC. b) GDI1 expression and lymph node involvement. c) GDI1 and distant metastasis. d) The left panel is the HR of each molecular subtype (vs. C1 subgroup). The right panel is the distribution of GDI1 in each molecular subgroup. e) Gene set enrichment analysis (GSEA) was performed to search GDI1-enriched gene signatures and signaling pathways in the GSE39582 dataset. GDI1 enriched cancer-related gene signatures are listed. f) The GDI1-enriched Liao metastasis signature was displayed as representative results of GSEA. In the upper panel, all genes were sorted out based on the rank between high-GDI1/ low-GDI1. The enrichment score was calculated based on the score of Liao metastasis signature genes. The heatmap is displayed on the lower panel. Each column represents one tissue sample, and each row represents each gene of Liao metastasis signature. Red means upregulated, and blue means downregulated. Most Liao metastasis signatures were upregulated in high-GDI1 subgroup but downregulated in the low-GDI1 subgroup in heatmap.
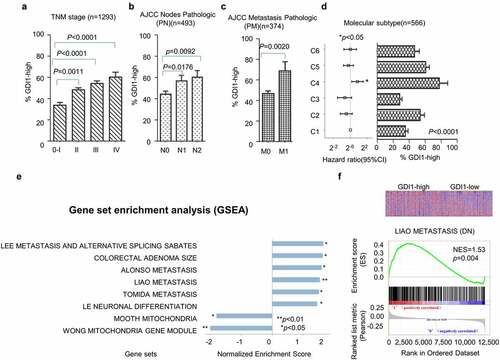
Figure 2. Survival analysis for GDI1 mRNA expression and outcome of CRC
For each dataset, the HR of GDI1 was estimated by univariate Cox proportional hazard analysis. Then, the overall HR of GDI1 was summarized by meta-analysis. Meanwhile, all participants from different datasets were merged after quantile normalization. The Kaplan–Meier plot visualized the GDI1 expression levels and outcomes of CRC. a) Meta-analysis of GDI1 and OS of CRC. b) Meta-analysis of DFS for CRC. c) Pooled Kaplan–Meier analysis for GDI1 and OS of CRC. d) Pooled Kaplan–Meier analysis for GDI1 and DFS of CRC. e) Parallel comparison of the prognostic performance of GDI1 and TNM stages. The HRs were based on Cox analysis in the GSE39582 dataset.
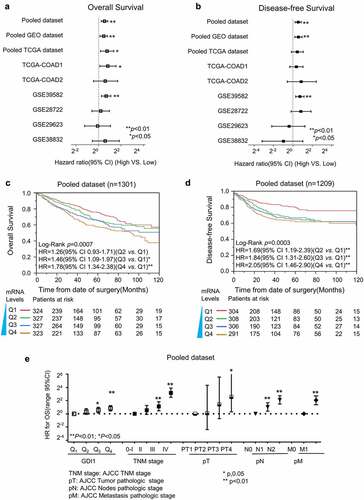
Figure 3. Immunohistochemistry analysis for the protein expression of GDI1 in the cytoplasm and membrane
The GDI1 antibody condition was optimized on a CRC board, and the specificity of the GDI1 antibody was also validated. a) The expression of GDI1 was scored by signal density in the cytoplasm and membrane. The representative score of GDI1 was displayed from (a)-(f). (a) Both cytoplasmic and membrane negative staining in CRC cells; (b) Cytoplasm weak positive and membrane weak positive staining; (c) Cytoplasm weak positive and membrane positive staining; (d) Cytoplasm positive and membrane negative staining; (e) Cytoplasm weak positive and membrane positive staining; (f) Strong positive in both cytoplasm and membrane. (b) Kaplan–Meier curve was plotted for GDI1 cytoplasm score and OS. Cox proportional hazard model determined the hazard ratio (HR). HR was adjusted by age, sex, Dukes’ stage. * p < 0.05; ** p < 0.01. c) Survival analysis for GDI1 membrane score and outcome of CRC.
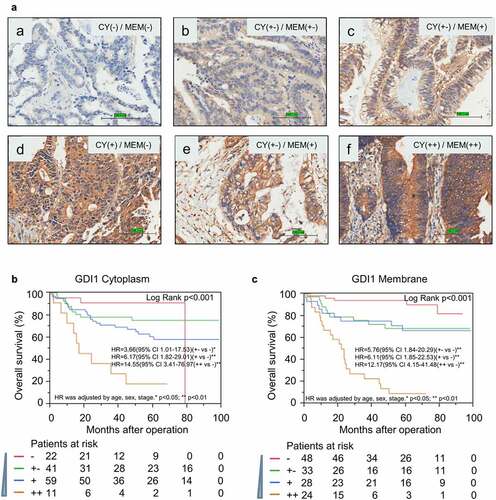
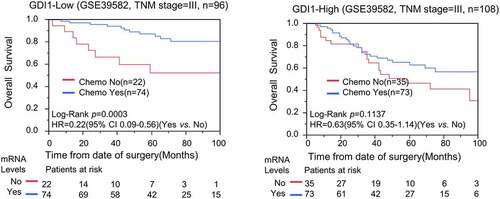
Figure 4. Stratification analysis for GDI1 expression and chemotheresistance in CRC patients
We only selected stage-III CRC patients in the GSE39582 dataset to reduce the confounding effects. The participants were stratified into High-GDI1 and low-GDI subgroups. The efficacy of chemotherapy was evaluated by Kaplan–Meier and Cox analyses. a) Chemotherapy significantly reduced the relative risk of death in low-GDI1 group. b) Chemotherapy did not reduce the relative risk of death in high-GDI1 group.
Supplemental material