Figures & data
Figure 1. CPT1C expression was reduced in Aβ25-35-induced HT22 cells. HT22 cells were treated with Aβ25-35 (20 μM) for 6 h, 12 h, 24 h or 48 h, respectively
Figure 2. CPT1C overexpression attenuated cell viability and toxic injury in Aβ25-35-induced HT22 cells. HT22 cells were transfected with Ov-CPT1C or Ov-NC for 24 h, and then treated with Aβ25–35 for another 24 h
Figure 3. CPT1C overexpression attenuated oxidative stress in Aβ25-35-induced HT22 cells. Following transfection of Ov-CPT1C or Ov-NC for 24 h, HT22 cells were treated with Aβ25–35 for another 24 h
Figure 4. CPT1C overexpression decreased the apoptosis of Aβ25-35-induced HT22 cells. Following transfection of Ov-CPT1C or Ov-NC for 24 h, HT22 cells were treated with Aβ25–35 for another 24 h
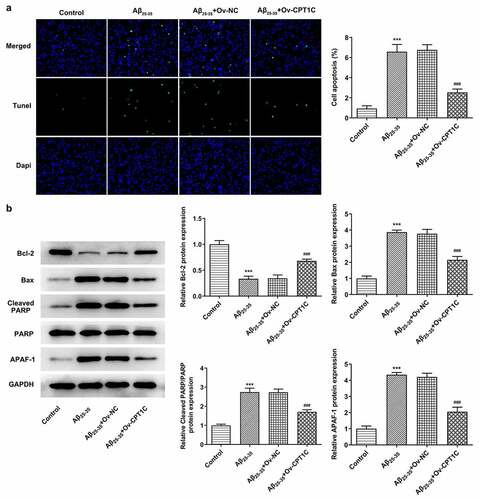
Figure 5. CPT1C overexpression decreased the deposition of AD marker proteins in Aβ25-35-induced HT22 cells. Following transfection of Ov-CPT1C or Ov-NC for 24 h, HT22 cells were treated with Aβ25–35 for another 24 h
Figure 6. PPARα activation could increase CPT1C expression in Aβ25-35-induced HT22 cells. HT22 cells were co-treated with gemfibrozil 100 μM or 250 μM, and Aβ25-35 for 48 h