Figures & data
Figure 1. The expressions of atrial fibrosis-related genes and proteins in HL-1 cells treated with Ang-(1-7)/Ang II. (a) The expressions of TGF-β, TIMP-1, MMP-2, CTGF, and galectin-3 genes were determined using qRT-PCR. (b) protein expressions of TGF-β, TIMP-1, MMP-2, CTGF, and galectin-3 were detected by western blot. @ represented p < 0.05 when compared with control; * represented p < 0.05 when compared with Ang II; # represented p < 0.05 when compared with Ang II+Ang-(1-7). Five SD rat samples per group
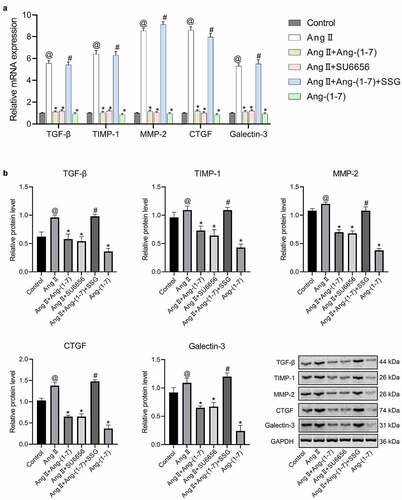
Figure 2. Expression of protein kinase signaling pathway in HL-1 cells treated with Ang-(1-7)/Ang II was determined using western blot. The phosphorylation level is equal to the ratio of phosphorylated proteins to total proteins. @ indicated p < 0.05 in comparison to the control; * indicated p < 0.05 in comparison to Ang II; # indicated p < 0.05 in comparison to Ang II+Ang-(1-7). Five SD rat samples per group
Figure 3. Ang-(1-7) antagonizes Ang II–induced systolic blood pressure increasing of rat caudal artery. significant differences were presented in different letters (p < 0.05). Five SD rat samples per group
Figure 4. Ang-(1-7) antagonized atrial fibrosis induced by Ang II. (a) picrosirius red staining of atrial sections. (b) masson’s trichrome staining of atrial sections. magnification 400 ×, Bar = 100 μm. @ represented the values of p < 0.05 in comparison to control; * represented the values of p < 0.05 in comparison to Ang II; # represented the values of p < 0.05 in comparison to Ang II+Ang-(1-7). Five SD rat samples per group
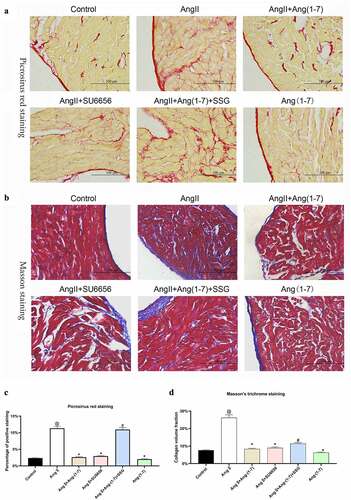
Figure 5. Ang-(1-7)/Ang II treatment regulates expressions of genes and proteins associated with atrial fibrosis. (a) Expressions of Collagen I and III were subjected to western blot. (b) expressions of collagen I and III were determined using immunohistochemistry assays. Bar = 100 μm. (c) expressions of α-SMA, TGF-β, TIMP, MMP-2, CTGF, and galectin-3 were determined using qRT-PCR. @ represented the values of p < 0.05 in comparison to Control; * represented the values of p < 0.05 in comparison to Ang II; # represented the values of p < 0.05 in comparison to Ang II+Ang-(1-7). 1: control; 2: Ang II; 3: Ang II + Ang-(1-7); 4: Ang II + SU6656; 5: Ang II+Ang-(1-7) + SSG; 6: Ang-(1-7). Five SD rat samples per group
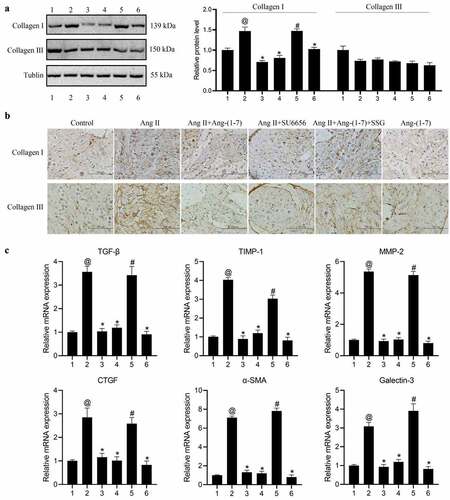
Figure 6. Ang-(1-7)/ang II treatment regulates the expression of atrial fibrosis and protein kinase signaling pathway-related proteins. (a, c) western blot was used to detect expressions of proteins associated with atrial fibrosis. (b, d) western blot was used to determine protein expressions related to the protein kinase signaling pathway. the phosphorylation level is equal to the ratio of phosphorylated proteins to total proteins. @ represented the values of p < 0.05 when compared with control; * represented the values of p < 0.05 when compared with Ang II; # represented the values of p < 0.05 when compared with Ang II+Ang-(1-7). 1: Control; 2: Ang II; 3: Ang II + Ang-(1-7); 4: Ang II + SU6656; 5: Ang II+Ang-(1-7) + SSG; 6: Ang-(1-7). Five SD rat samples per group
Figure 7. SHP-1 is directly bound to c-Src. (a) Co-IP assay using SHP-1 antibody. (b) Co-IP assay using a c-Src antibody. (c and d) phosphorylation of SHP-1 and c-Src was determined. Ang II could promote c-Src phosphorylation but weaken that of SHP-1. ang-(1-7) antagonized the activation of ang II–induced c-Src through promoting SHP-1 phosphorylation. @ represented the values of p < 0.05 compared with control; * represented the values of p < 0.05 compared with ang II; # represented the values of p < 0.05 compared with Ang II+Ang-(1-7). five SD rat samples per group