1,014
Views
4
CrossRef citations to date
0
Altmetric
Research Paper

microRNA-3646 serves as a diagnostic marker and mediates the inflammatory response induced by acute coronary syndrome

, , , , & ORCID Icon
Pages 5632-5640 | Received 07 Jun 2021, Accepted 06 Aug 2021, Published online: 14 Sep 2021

Figures & data

Table 1. The clinical features of study subjects

Table 2. Association between miR-3646 expression and clinical features of ACS patients

Figure 1. The expression of miR-3646 and its diagnostic value in ACS patients. A. miR-3646 was significantly upregulated in the serum of ACS patients compared with that in healthy volunteers and non-ACS patients. ***P < 0.001 relative to healthy volunteers; ###P < 0.001 relative to non-ACS patients. B. miR-3646 could distinguish ACS patients from healthy volunteers with an AUC of 0.884. C. miR-3646 could distinguish ACS patients from non-ACS patients with the AUC of 0.825

Figure 1. The expression of miR-3646 and its diagnostic value in ACS patients. A. miR-3646 was significantly upregulated in the serum of ACS patients compared with that in healthy volunteers and non-ACS patients. ***P < 0.001 relative to healthy volunteers; ###P < 0.001 relative to non-ACS patients. B. miR-3646 could distinguish ACS patients from healthy volunteers with an AUC of 0.884. C. miR-3646 could distinguish ACS patients from non-ACS patients with the AUC of 0.825

Figure 2. The correlation of miR-3646 with the TC (a), LDL (b), and GLU (c) levels of ACS patients. miR-3646 showed significantly positive correlation with the TC (r = 0.785), LDL (r = 0.746), and GLU (r = 0.717) levels of ACS patients

Figure 2. The correlation of miR-3646 with the TC (a), LDL (b), and GLU (c) levels of ACS patients. miR-3646 showed significantly positive correlation with the TC (r = 0.785), LDL (r = 0.746), and GLU (r = 0.717) levels of ACS patients

Figure 3. The expression of miR-3646 in ACS modeling rats was obtained from six rats in each group. miR-3646 was significantly upregulated in ACS modeling rats, which was reversed by the injection of miR-3646 interference plasmid. **P < 0.01, ***P < 0.001 relative to the sham group; ###P < 0.001 relative to the ACS group
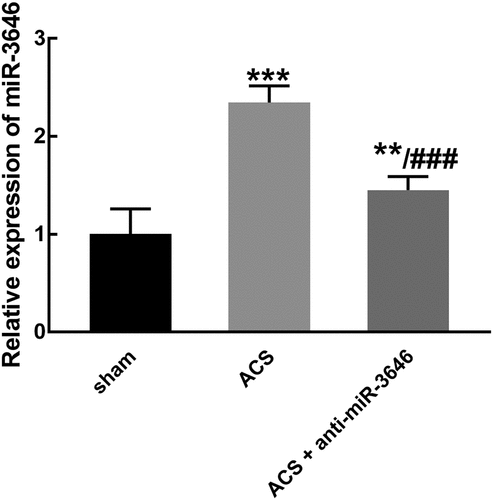
Figure 3. The expression of miR-3646 in ACS modeling rats was obtained from six rats in each group. miR-3646 was significantly upregulated in ACS modeling rats, which was reversed by the injection of miR-3646 interference plasmid. **P < 0.01, ***P < 0.001 relative to the sham group; ###P < 0.001 relative to the ACS group

Figure 4. The effect of miR-3646 on the relative levels of pro-inflammatory cytokines was studied in six rats of each group. ACS induced the increasing levels of TNF-α (a), IL-6 (b), and IL-8 (c), which was reversed by the knockdown of miR-3646. *P < 0.05, ***P < 0.001 relative to the sham group; ##P < 0.01 relative to the ACS group

Figure 4. The effect of miR-3646 on the relative levels of pro-inflammatory cytokines was studied in six rats of each group. ACS induced the increasing levels of TNF-α (a), IL-6 (b), and IL-8 (c), which was reversed by the knockdown of miR-3646. *P < 0.05, ***P < 0.001 relative to the sham group; ##P < 0.01 relative to the ACS group

Table 3. The corresponding features of rats in each group

Figure 5. The effect of miR-3646 on the TC (a), TG (b), LDL (c), and GLU (d) of rats (six rats of each group). ACS induced a significant increase in the levels of TC, LDL, and GLU, while no significant changes were observed in the level of TG. *P < 0.05, ***P < 0.001 compared with the sham group; #P < 0.05, ##P < 0.01 compared with the ACS group
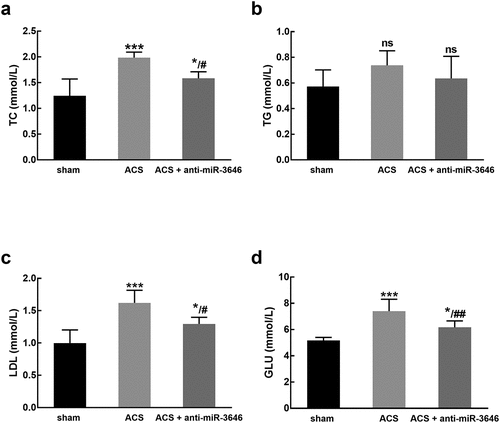
Figure 5. The effect of miR-3646 on the TC (a), TG (b), LDL (c), and GLU (d) of rats (six rats of each group). ACS induced a significant increase in the levels of TC, LDL, and GLU, while no significant changes were observed in the level of TG. *P < 0.05, ***P < 0.001 compared with the sham group; #P < 0.05, ##P < 0.01 compared with the ACS group