
Figures & data
Table 1. The main information of GC expression analyses from TCGA data and GEO datasets
Figure 1. The expression level of GXYLT2 was significantly up-regulated in gastric cancer samples
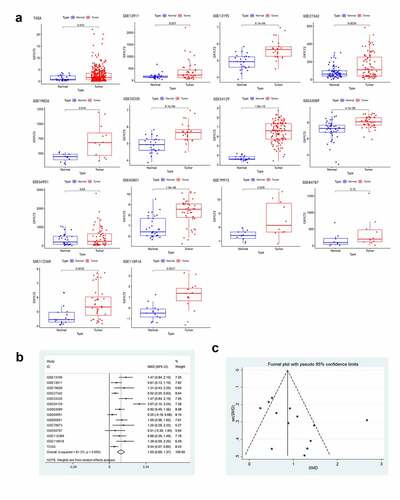
Figure 2. GXYLT2 could be used as a diagnostic marker for patients with gastric cancer based on the results of analysis of the diagnostic values
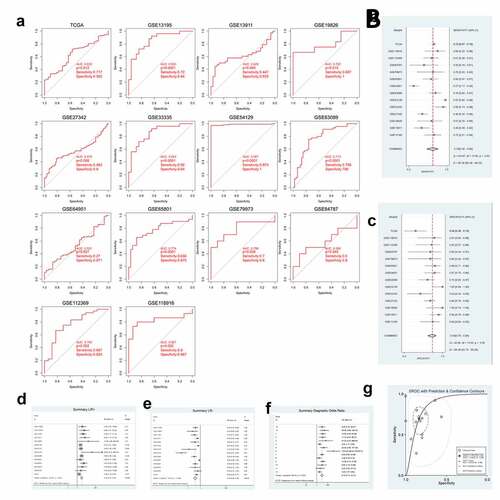
Table 2. Relationships between GXYLT2expression and clinicopathological parameters in GC patients
Figure 3. GXYLT2 might serve as a prognostic marker in patients with GC
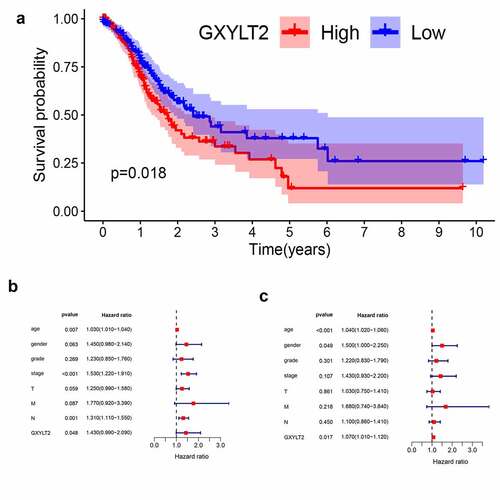
Figure 4. GSEA identified GXYLT2-related tumor pathways and immune regulatory. The terms related to tumor pathways were ‘ECM Receptor Interaction,’ ‘Focal Adhesion,’ ‘Wnt Signaling Pathway,’ ‘Gap Junction,’ and ‘Cell Adhesion Molecules (CAMs)’. The terms related to immunity were ‘Complement and Coagulation Cascades,’ ‘Cytokine Receptor Interaction,’ ‘TGF Beta Signaling Pathway,’ and ‘Leukocyte Transendothelial Migration’
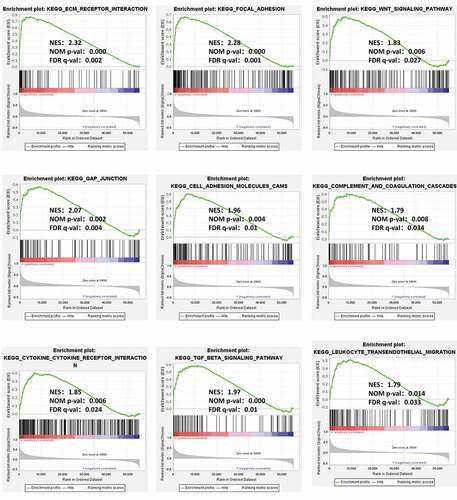
Figure 5. Identification of differences and correlation between the GXYLT2 expression level and tumor-infiltrating immune cells in in GC patients
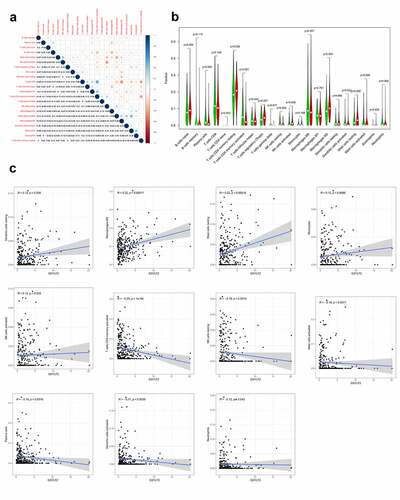
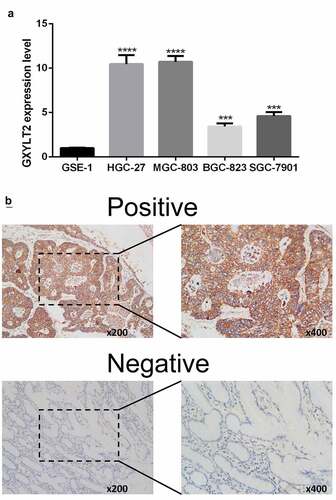
Figure 6. Verification of upregulation of GXYLT2 expression levels in GC by qRT-PCR and Immunohistochemistry test. (a)The mRNA levels of GXYLT2 in normal gastric cell and gastric cancer cell lines. (b) Representative images of GXYLT2 immunohistochemistry in GC tissue
Data accessibility
Publicly available datasets were analyzed in this study, these can be found in GEO database (https://www.ncbi.nlm.nih.gov/geo), and The Cancer Genome Atlas (https://portal.gdc.cancer.gov). The authors confirm that the data supporting the findings of this study are available within the article and its supplementary materials.