Figures & data
Table 1. Clinical characteristics of patients with GDM and healthy controls in this study
Figure 1. The expression of circ_0074673 is increased in the exosomes isolated from the umbilical cord blood of patients with GDM. (a) The morphology of the exosomes was visualized by TEM. (b) The size of the exosomes was detected by NTA. (c) The size of the exosomes was quantified. (d) The levels of CD9 and CD63 were determined by western blotting. (e) The expression of circ_0074673 was detected by qPCR. Each experiment was repeated in three times. **P < 0.01
Figure 2. The silence of circ_0074673 promoted the biological functions of HG-HUVECs. (a) The exosomes were labeled using PKH67 and co-cultured with HUVECs. The images were captured using a fluorescence confocal microscope. (b) The levels of circ_0074673 in the HUVECs and exo-HUVECs were measured by qPCR. (c) Following si-circ_0074673 transfection, the level of circ_0074673 was determined by qPCR. (d) Cellular proliferation was analyzed by the CCK-8 assay. (e) Cellular migration was assessed by the transwell assay. (f) Cellular angiogenesis was analyzed using the tube formation assay. Each experiment was repeated in three times. **P < 0.01. ***P < 0.001
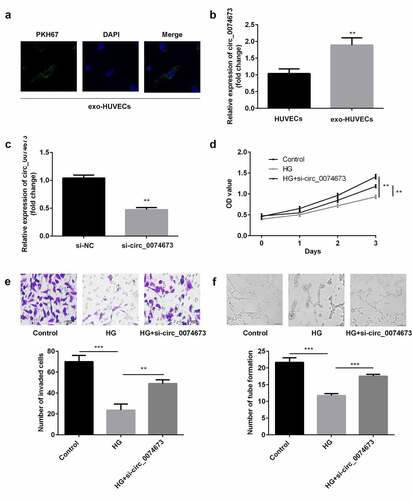
Figure 3. Circ_0074673 serves as an miR-1200 sponge. (a) MiR-1200 targets the 3′-UTR sequence of circ_004673. (b) The relative luciferase activity was determined using the luciferase reporter assay. (c) Circ_0074673 and miR-1200 co-immunoprecipitated with AGO2 was determined by RIP assay. (d) Circ_0074673 pulled-down with biotin-labeled miR-1200 by RNA pull-down assay. (e) Following si-circ_0074673 transfection, the levels of miR-1200 were detected using qPCR. Each experiment was repeated in three times. **P < 0.01. ns P > 0.05
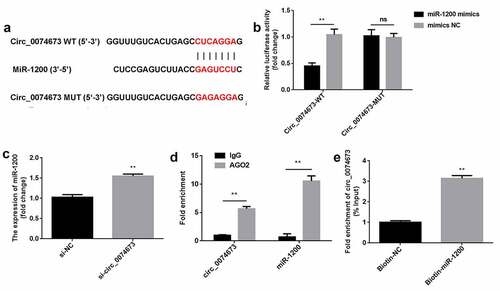
Figure 4. Circ_0074673 silencing promoted the biological behaviors of HG-HUVECs by sponging miR-1200. (a) The levels of miR-1200 were measured by qPCR following transfection with the miR-1200 inhibitor. (b) Cellular proliferation was analyzed using the CCK-8 assay. (c) Cellular migration was assessed by the transwell assay. (d) Cellular angiogenesis was analyzed by the tube formation assay. Each experiment was repeated in three times. **P < 0.01. ***P < 0.001
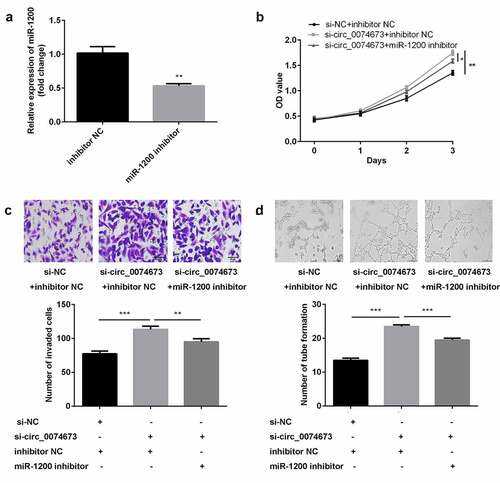
Figure 5. MiR-1200 directly targets MEOX2. (a) MiR-1200 targets the 3′-UTR region of MEOX2. (b) The relative luciferase activity was measured using the luciferase reporter assay. (c) MiR-1200 and MEOX2 co-immunoprecipitated with AGO2 was determined by RIP assay. (d) MEOX2 pulled-down with biotin-labeled miR-1200 using RNA pull-down assay. (e) The levels of MEOX2 following transfection with miR-1200 mimics were detected using qPCR. Each experiment was repeated in three times. **P < 0.01. ns P > 0.05
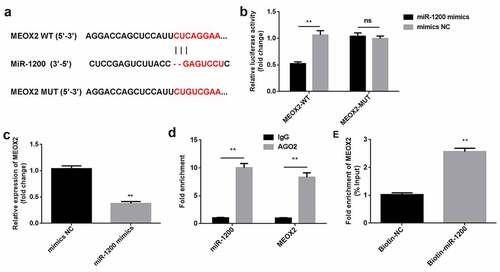
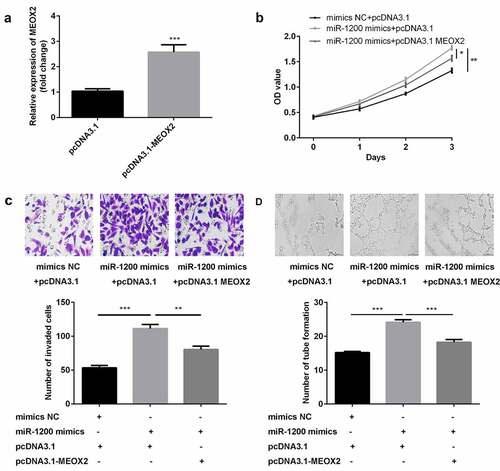
Figure 6. The overexpression of miR-1200 promoted the biological functions of HG-HUVECs by targeting MEOX2. (a) The levels of MEOX2 were measured by qPCR following transfection with pcDNA3.1-MEOX2. (b) Cellular proliferation was analyzed by the CCK-8 assay. (c) Cellular migration was assessed by the transwell assay. (d) Cellular angiogenesis was analyzed using the tube formation assay. Each experiment was repeated in three times. **P < 0.01. ***P < 0.001