Figures & data
Table 1. A summary of the characteristics of FDA-approved TNF inhibitors and Haidalimumab
Figure 1. Expression and purification of Haidalimumab. (a) map of expression vector. (b) non-reducing SDS-PAGE electrophoresis illustrated antibodies before and after purification, (c) reducing SDS-PAGE electrophoresis illustrated antibodies before and after purification. Description of wells is as follows: Sample is the supernatant from fermentation, flow-through is the solution that flows out after loading sample and before washing, elution1, elution2 and elution3 are the eluents of the target protein collected at different time points, (d) cell culture supernatant was purified using MabSelect SuRe™ (protein A affinity chromatography), and the elution peak that contained antibodies was identified (the arrow in ). (e) the eluate from D was then purified by cation-exchange chromatography and the eluate was collected (the arrow in ). (f) the eluate from E was then purified using anion-exchange chromatography; the eluate (purified Haidalimumab) was collected. (g) the eluate from F showed a specific absorption peak at 280 nm, confirming that Haidalimumab is a protein
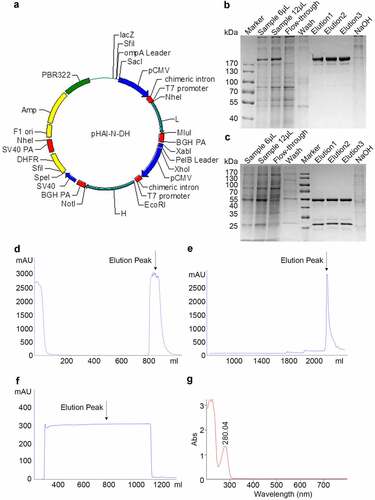
Table 2. Group design for Haidalimumab treatment of rhTNFα-induced liver damage in C57BL/6 mice
Table 3. Inhibitory effect of Haidalimumab and Humira on induction of rabbit fever by rhTNFα
Figure 2. Purity, isoelectric point, and protein sequence analysis of Haidalimumab. (a) reducing SDS-PAGE showed the heavy- and light-chains of the antibody with molecular weights of about 55 and 28 kDa, respectively. Non-reducing SDS-PAGE showed one band at about 180 kDa. (b) the purity of Haidalimumab determined by high-performance liquid chromatography was 98.26%. (c) the isoelectric point of Haidalimumab was about 8.26. (d) protein sequence analysis of Haidalimumab. Amino acid sequences of the N-terminal end of the heavy-chain and the light-chain were EVQLVESGGLGQPG and EIVLTQSPDFQSVTP respectively, which were also consistent with the expected sequence. The coverage of heavy-chain peptide segments toward the C-terminal end had a total of 450 amino acids, 347 amino acids (yellow highlight) were identified, accounting for 77.11% of the total amino acid sequence. The light-chain had a total of 214 amino acids, of which 133 (yellow highlight) were identified, accounting for 62.15% of the total amino acid sequence
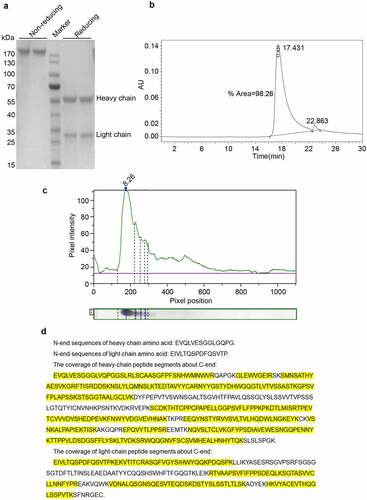
Figure 3. Potency analysis in vitro. (a) affinity of Haidalimumab and Humira. The KD (affinity constant) of Haidalimumab for TNFα was 7.74 (± 0.14) E−[Citation10]. The KD of Humira was 1.32 (± 0.43) E−[Citation10]. (b) neutralizing activity of Haidalimumab and Humira in L929 cells, as calculated from the graphs. The EC50 value of Haidalimumab was 19.498, 17.989, 15.776 ng/mL, while that of Humira was 68.234, 65.163, 74.131 ng/mL (P < 0.01). Haidalimumab1st, Haidalimumab2nd, and Haidalimumab3rd represent antibodies produced in different batches
![Figure 3. Potency analysis in vitro. (a) affinity of Haidalimumab and Humira. The KD (affinity constant) of Haidalimumab for TNFα was 7.74 (± 0.14) E−[Citation10]. The KD of Humira was 1.32 (± 0.43) E−[Citation10]. (b) neutralizing activity of Haidalimumab and Humira in L929 cells, as calculated from the graphs. The EC50 value of Haidalimumab was 19.498, 17.989, 15.776 ng/mL, while that of Humira was 68.234, 65.163, 74.131 ng/mL (P < 0.01). Haidalimumab1st, Haidalimumab2nd, and Haidalimumab3rd represent antibodies produced in different batches](/cms/asset/0fdc03b5-35ba-41a4-a022-f13d476707fb/kbie_a_1967710_f0003_oc.jpg)
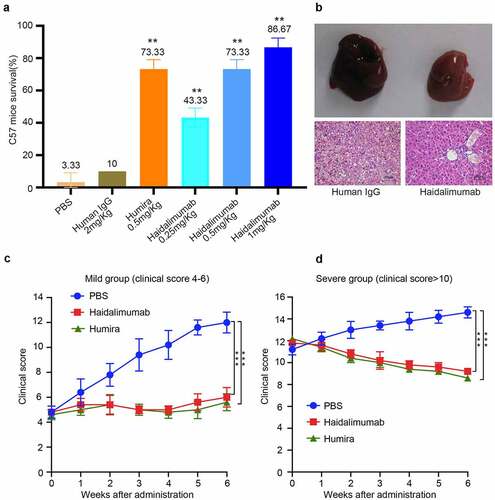
Figure 4. Safety and potency analysis in vivo. (a) the protective effect of antibodies on D-galactosamine and rhTNFα-induced liver damage. Survival rate of C57BL/6 mice was calculated after the mice were injected with antibodies for protection from liver damage induced by D-galactosamine and rhTNFα. Haidalimumab at 0.5 mg/kg and 1.0 mg/kg treatment groups showed 73.3% and 86.67% survival rate, respectively, and the survival rate of the Haidalimumab at 0.5 mg/kg treatment group was the same as that of the Humira treatment group. Compared with human IgG group *0.001 < P < 0.05, ** P < 0.001. (b) morphological analysis and hematoxylin and eosin staining analysis of liver damage in mice; the livers of mice in the human IgG-treatment group showed acute damage, manifested as a large number of cells showing apoptosis and necrosis, significant liver swelling, and congestion. In contrast, the livers of Haidalimumab-treated mice had normal morphology of liver tissue. (c) relief from arthritis in TNF-Tg mice with mild (clinical score 4–6, n = 5 mice per group) arthritis were treated; after about a week, the Humira and Haidalimumab treatments were effective and equivalent. (d) relief from arthritis in TNF-Tg mice with severe (clinical score ≥10, n = 5 mice per group) arthritis; after about a week, the Humira and Haidalimumab treatments were effective and equivalent. ***P < 0.001