Figures & data
Table 1. Primers for real time PCR
Figure 1. Differentiation of hBM-MSCs into osteoblasts. (a) Alizarin Red staining of hBM-MSCs shows a large number of calcified nodules in 14 days. (b) Relative mRNA expression of ALP and RUNX2 during osteogenic differentiation of hBM-MSCs determined by qRT-PCR. ns, not significant relative to D0 group, P > 0.05; *P < 0.05; **P < 0.01
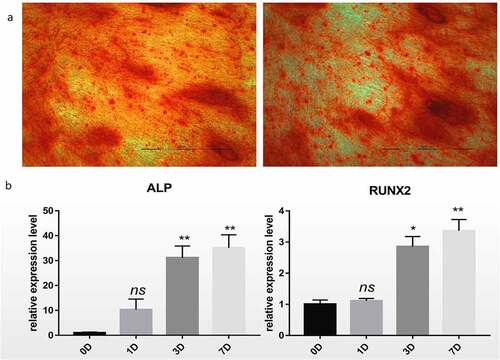
Figure 2. Construction of circRNA–miRNA–mRNA network and expression of hsa_circ_0006766 during osteogenic differentiation of hBM-MSCs. (a) Relative expression of hsa_circ_0006766 during osteoblastic differentiation of hBM-MSCs as determined by qRT-PCR analysis. ns, not significant relative to D0 group, P > 0.05; * P < 0.05; ** P < 0.01. (b) The network of circRNA–miRNA–mRNA consisting of hsa_circ_0006766(green node), target miRNAs (yellow squares) and their target mRNAs(blue nodes), in which the bone metabolism related target mRNAs is marked with red
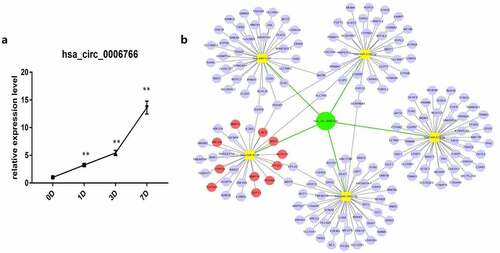
Figure 3. Functional and pathway enrichment analysis of hsa_circ_0006766. (a) Results of GO analysis. (b) Top 10 GO terms (biological processes) determined by GO analysis according to the enrichment score. (c) Top 10 pathways determined by KEGG analysis according to the enrichment score. (d) Map of hsa_circ_0006766-mediated MAPK signaling pathway
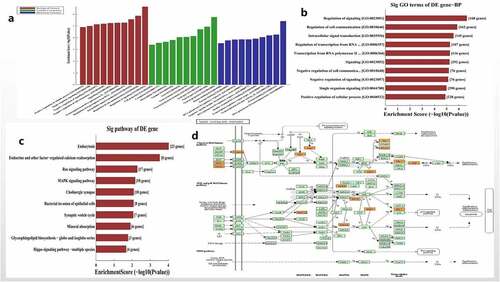
Figure 4. Relative expression of the predicted target miRNAs of hsa_circ_0006766 determined by qRT-PCR. (a–e) Expression of the five predicted MREs of hsa_circ_0006766. (f–h) Expression of the predicted target genes of miR-4739 related to bone metabolism. ns, not significant relative to D0 group, P > 0.05; *P < 0.05; **P < 0.01; ***P < 0.001; ****P < 0.0001
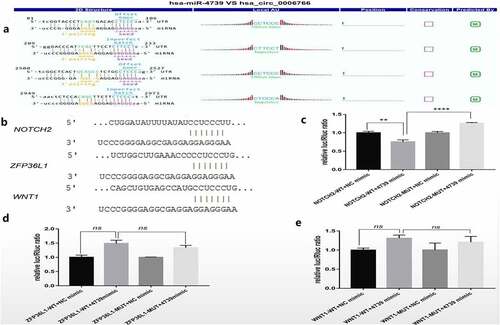
Figure 5. Dual luciferase reporter detection of target genes of miR-4739. (a)Detailed annotation map of hsa_circ_0006766 with miR-4739. Only the binding sites of the coding sequence in hsa_circ_0006766 are shown.(b) Predicted binding sites of miR-4739 in Notch2, ZFP36L1, and Wnt1 determined by TargetScan. Relative luciferase activities in cells overexpressing miR-4739 with wild-type or mutated miR-4739 binding sites in (c) Notch2, (d) ZFP36L1, and (e) Wnt1. ns, not significant, P > 0.05; ** P < 0.01; ****P < 0.0001