
Figures & data
Table 1. Correlation between ACTN1 expression and clinicopathologic characteristics of gastric cancer patients (GSE62254)
Table 2. Correlation between ACTN1 expression and clinicopathologic characteristics of gastric cancer patients (GSE84437)
Figure 1. Aberrant expression of ACTN1 in GC. a High-throughput sequencing results obtained from 10 pairs of GC tumors (tumor) and adjacent normal tumors (normal). b Aberrant expression of ACTN1 between 408 GC samples and 211 non-carcinoma samples obtained from TCGA database and GTEx as per the GEPIA (P < 0.05 *). c Multiple gene symbols (208636_at; 208637_x_at; 211160_x_at) showed that ACTN1 was related to poor overall survival as per the Kaplan–Meier Plotter (Log-rank P < 0.001). d GSE79973 (tumor n(t) = 10; normal n(n) = 10), GSE118916 (tumor n(t) = 15; normal n(n) = 15), GSE54129 (tumor n(t) = 111; normal n(n) = 21), GSE56807 (tumor n(t) = 5; normal n(n) = 5), GSE26942 (tumor n(t) = 205; normal n(n) = 12)) showing ACTN1 was significantly upregulated in gastric cancer (GC) tumors (P < 0.05 was regarded as statistical significance)
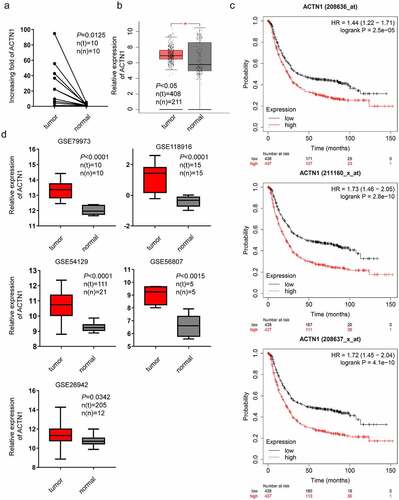
Figure 2. Aberrant expression of ACTN1 on levels of GC tissue and cell line. a Western blotting showed that ACTN1 was up-regulated in 8 of 10 pairs of GC tumor samples (tumor) relative to adjacent normal tumors (normal). b The mRNA level of ACTN1 between 19 pairs of gastric cancer (GC) tumors (tumor) and adjacent normal tumors (normal) by RT-qPCR. c The representative immunohistochemistry of ACTN1 (magnification: 200×; 400×; Scale bars 20um). d-and e. Protein (d) and mRNA (e) levels of ACTN1 between human gastric epithelial cell line (GES-1) and GC cells (HGC-27, AGS, MKN-45, and MKN-28) (P < 0.05 *, <0.01 **, <0.001 ***, <0.0001 ****; GAPDH as loading control for RT-qPCR and WB)
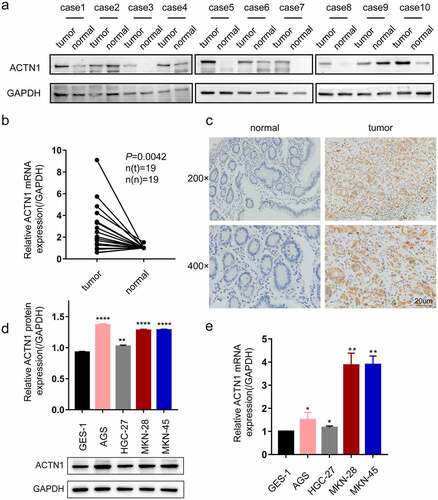
Figure 3. ACTN1 promotes the proliferation of GC. a The transfection efficiency of ACTN1 overexpression plasmid [OE] was confirmed by RT-qPCR in GC cells (with empty plasmid as negative control [VEC]). b RT-qPCR and WB analysis showed that siRNA3 had the highest knockdown efficiency (with siR-NC as negative control [NC]). c siRNA3 and ACTN1 overexpression plasmid were used for subsequent knockdown and overexpression experiments (siRNA3 [SH], siR-NC [NC], ACTN1 overexpression plasmid [OE], control plasmid [VEC]). d The proliferation ability of gastric cancer detected by EDU incorporation. The histogram of EDU-positive rate was quantified using the GraphPad, which showed that the overexpression of ACTN1 promoted the proliferation, whereas its knockdown reversed this effect (magnification: 100×; Scale bars 20um; P < 0.05 *, <0.01 **, <0.001 ***, <0.0001 ****)
![Figure 3. ACTN1 promotes the proliferation of GC. a The transfection efficiency of ACTN1 overexpression plasmid [OE] was confirmed by RT-qPCR in GC cells (with empty plasmid as negative control [VEC]). b RT-qPCR and WB analysis showed that siRNA3 had the highest knockdown efficiency (with siR-NC as negative control [NC]). c siRNA3 and ACTN1 overexpression plasmid were used for subsequent knockdown and overexpression experiments (siRNA3 [SH], siR-NC [NC], ACTN1 overexpression plasmid [OE], control plasmid [VEC]). d The proliferation ability of gastric cancer detected by EDU incorporation. The histogram of EDU-positive rate was quantified using the GraphPad, which showed that the overexpression of ACTN1 promoted the proliferation, whereas its knockdown reversed this effect (magnification: 100×; Scale bars 20um; P < 0.05 *, <0.01 **, <0.001 ***, <0.0001 ****)](/cms/asset/cb9b83ef-a500-4078-a6de-57c0c4ab81c5/kbie_a_1967713_f0003_oc.jpg)
Figure 4. ACTN1 promotes the invasion, migration and inhibits apoptosis of GC. a Cell apoptosis analysis results following ACTN1 knockdown or overexpression in AGS and MKN-28 cells. b The invasion, and migration abilities of knock downed and overexpressed ACTN1 in gastric cancer (GC) (magnification: 100×; Scale bars 20um). c Wound healing assay showed that overexpressing ACTN1 promoted the migration of gastric cancer (GC), whereas its knockdown suppressed the migration of GC (magnification: 40×; Scale bars 20um) (P < 0.05 *, <0.01 **, <0.001 ***, <0.0001 ****)
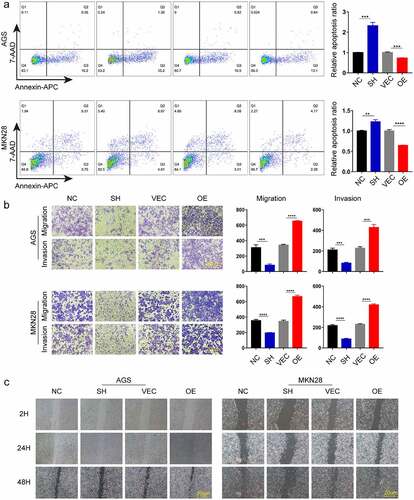
Figure 5. ACTN1 regulates EMT in gastric cancer. a Correlation analysis via bioinformatics website (The Encyclopedia of RNA Interactomes ENCORI) shows that ACTN1 is positively related to mesenchymal markers (CDH2, VIM, SNAI1, SNAI2, ZEB1, TWIST1, TWIST2) and negatively related to the epithelial marker (CDH1) (P < 0.0001). b Co-immunofluorescence of E-cadherin (the epithelial marker) and Vimentin (the mesenchymal marker) revealed that ACTN1 up-regulation remarkably up-regulated Vimentin whereas down-regulated E-cadherin (Vimentin stained green; E-cadherin stained red; nuclei stained blue [DAPI]). c Protein levels of EMT-related molecules (the epithelial marker E-cadherin; the mesenchymal marker Vimentin, and the EMT-related transcription factor Snail) between ACTN1 silenced and overexpressed groups by WB (P < 0.05 *, <0.01 **, <0.001 ***, <0.0001 ****; Scale bars: 20 μm)
![Figure 5. ACTN1 regulates EMT in gastric cancer. a Correlation analysis via bioinformatics website (The Encyclopedia of RNA Interactomes ENCORI) shows that ACTN1 is positively related to mesenchymal markers (CDH2, VIM, SNAI1, SNAI2, ZEB1, TWIST1, TWIST2) and negatively related to the epithelial marker (CDH1) (P < 0.0001). b Co-immunofluorescence of E-cadherin (the epithelial marker) and Vimentin (the mesenchymal marker) revealed that ACTN1 up-regulation remarkably up-regulated Vimentin whereas down-regulated E-cadherin (Vimentin stained green; E-cadherin stained red; nuclei stained blue [DAPI]). c Protein levels of EMT-related molecules (the epithelial marker E-cadherin; the mesenchymal marker Vimentin, and the EMT-related transcription factor Snail) between ACTN1 silenced and overexpressed groups by WB (P < 0.05 *, <0.01 **, <0.001 ***, <0.0001 ****; Scale bars: 20 μm)](/cms/asset/ffda7950-b126-4241-ab18-bd03401a4002/kbie_a_1967713_f0005_oc.jpg)
Figure 6. ACTN1 promotes stability and nuclear translocation of β-catenin. a The ENCORI shows that ACTN1 is positively related to β-catenin (CTNNB1) and its downstream target genes (CD44, FN1, C-JUN, L1CAM, MMP14) (P < 0.001). b Western blotting showed that the ACTN1 overexpression increased the protein levels of total β-catenin (t-β-catenin), nuclear β-catenin (n-β-catenin), and cyclin D1, whereas it inhibited the protein levels of p-β-catenin (phosphorylated at T41 and S45). The knockdown of ACTN1 produced the opposite effects (LaminB1 as loading control for nucleoprotein). c Transcription levels of cyclin D1 (CCND1) and β-catenin (CTNNB1) were assessed between ACTN1 silenced and overexpressed groups by RT-qPCR (P < 0.05 *, <0.01 **, <0.001 ***, <0.0001 ****). d Immunofluorescence showed that ACTN1 overexpression significantly up-regulated cytoplasmic β-catenin level, with a simultaneously moderate increase of β-catenin in the nucleus which is indicated by a red arrow. The knockdown of ACTN1 produced the opposite effects (Scale bars: 20 μm)
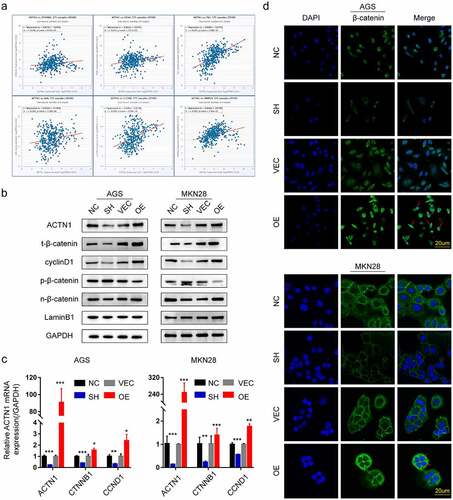
Figure 7. ACTN1 promotes the tumorigenesis and development of gastric cancer through the AKT/GSK3β/β-catenin pathway and promotes EMT. a The overexpression of ACTN1 significantly promoted the phosphorylation of AKT (Ser473) and GSK3β (Ser9), whereas its knockdown inhibited this phosphorylation. b The AKT inhibitor MK2206 (10 mM) significantly rescued the migration-promoting effect of overexpressed ACTN1 in gastric cancer (GC) cells (Dimethylsulfoxide [DMSO] as control; Scale bars: 20 μm). c Western blotting revealed that ACTN1 up-regulation enhanced p-AKT, p-GSK3β, β-catenin, and Snail expression, and inhibited the phosphorylation of β-catenin. The AKT inhibitor MK2206 (10 mM) partially rescued the effect of ACTN1
![Figure 7. ACTN1 promotes the tumorigenesis and development of gastric cancer through the AKT/GSK3β/β-catenin pathway and promotes EMT. a The overexpression of ACTN1 significantly promoted the phosphorylation of AKT (Ser473) and GSK3β (Ser9), whereas its knockdown inhibited this phosphorylation. b The AKT inhibitor MK2206 (10 mM) significantly rescued the migration-promoting effect of overexpressed ACTN1 in gastric cancer (GC) cells (Dimethylsulfoxide [DMSO] as control; Scale bars: 20 μm). c Western blotting revealed that ACTN1 up-regulation enhanced p-AKT, p-GSK3β, β-catenin, and Snail expression, and inhibited the phosphorylation of β-catenin. The AKT inhibitor MK2206 (10 mM) partially rescued the effect of ACTN1](/cms/asset/17eae80e-93d7-4823-a364-49590ac58e79/kbie_a_1967713_f0007_oc.jpg)
Data availability statement
The datasets and experimental data used and/or analyzed in this study are available from the corresponding author on reasonable request.