Figures & data
Figure 1. The NUP160 level in HG-treated NRK-52E cells and in DN mice. (a) The NUP160 mRNA level in HG-treated NRK-52E cells was measured by RT-qPCR. (b) The NUP160 protein level in HG-treated NRK-52E cells was determined by western blot. (c) The NUP160 mRNA level in DN mice was measured by RT-qPCR. (d) The NUP160 protein level in DN mice was measured by western blot. **P < 0.01, ***P < 0.001
Figure 2. Autophagy level in HG-treated NRK-52E cells and in DN mice. (a) The protein expression of autophagy-related markers and Col-IV in HG-treated NRK-52E cells was assessed by western blot. (b) The protein expression of autophagy-associated markers in DN mice was assessed by western blot. ***P < 0.001
Figure 3. Effects of NUP160 depletion on autophagy in HG-treated NRK-52E cells. (a) The protein levels of NUP160, p62, LC3-I/II, and Col-IV in HG-treated NRK-52E cells transfected with sh-NUP160 were examined by western blot. (b) The expression of LC3B in HG-treated NRK-52E cells transfected with sh-NUP160 was examined using immunofluorescence assay. **P < 0.01, ***P < 0.001
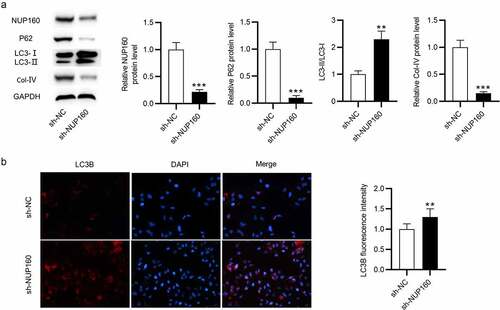
Figure 4. Effects of NUP160 depletion on inflammatory response in HG-treated NRK-52E cells. (a) The protein levels of IL-1β, IL-6, and TNF-α in HG-treated NRK-52E cells transfected with sh-NUP160 were examined by western blot. **P < 0.01, ***P < 0.001 vs. the control group; #P < 0.05, ##P < 0.01 vs. the HG+sh-NC group
Table 1. Biochemical characteristics after 8 weeks of treatment with AAV-sh-NUP160 in DN mice
Figure 5. Effects of NUP160 depletion on body weight, blood glucose and insulin in DN mice. (a) The experimental design of the in vivo study is presented in a schematic diagram. (b) Body weight in each group. (c) Fasting blood glucose levels in each group. (d) Changes in the glucose levels in the OGTT. (e) Serum insulin content in each group. **P < 0.01, ***P < 0.001 vs. the sham group; #P < 0.05 vs. the DN+AAV-NC group
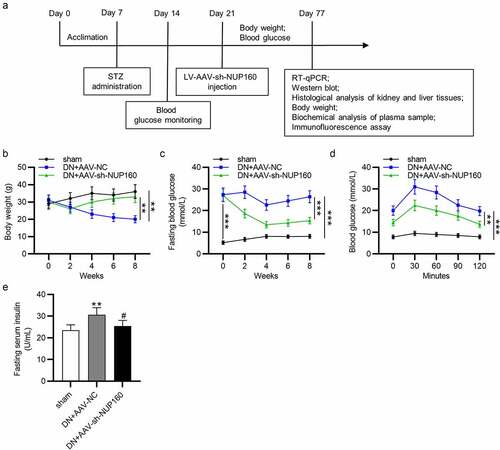
Figure 6. Effects of NUP160 depletion on kidney and liver histopathological changes. (a) Histopathological changes in the kidney. (b) Histopathological changes in the liver. (c) Serum ALT content. (d) Serum AST content. **P < 0.01 vs. the sham group; #P < 0.05 vs. the DN+AAV-NC group
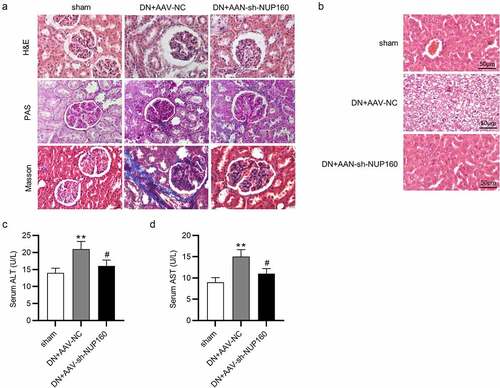
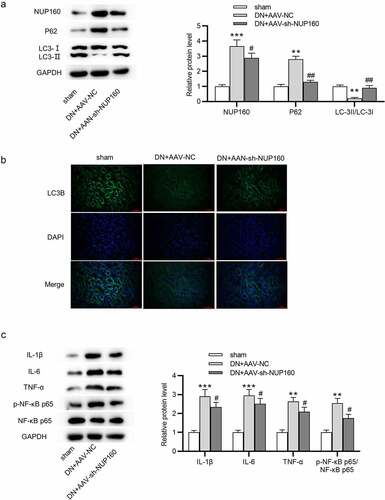
Figure 7. Effects of NUP160 depletion on autophagy and inflammatory response in DN mice. (a) The protein expression of autophagy-related markers and Col-IV in DN mice was determined by western blot. (b) The expression of LC3B in DN mice was determined by immunofluorescence assay. (c) The protein levels of IL-1β, IL-6, and TNF-α in DN mice were examined by western blot. **P < 0.01, ***P < 0.001 vs. the sham group; #P < 0.05, ##P < 0.01 vs. the DN+AAV-NC group