Figures & data
Figure 1. Intestinal microbial changes after quercetin treatment in OA rats. (a) Alpha diversity was evaluated using the Shannon index. Average relative abundances of dominant bacterial classes (b) and genera (c) in the intestine under quercetin treatment
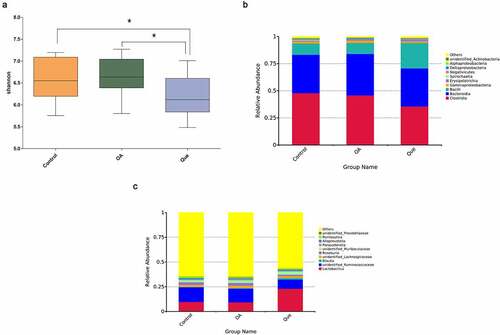
Figure 2. Quercetin increased SCFA levels. The levels of acetic acid (a) and propionic acid (b) were measured using GC-MS in the three groups. The values are presented as the means ± SDs, **P < 0.01 and *P < 0.05
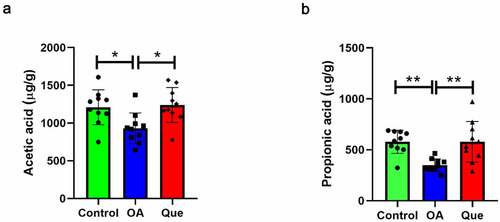
Figure 3. Effect of disruption on the fecal metabolome. Partial least square-discriminant analysis (PLS-DA) of MS data. (a) PLS-DA for positive ion mode data. (b) PLS-DA for negative ion mode data. (c) Fecal metabolite disorder in the three groups. The data are presented as the means ± SDs. Significant differences between groups are indicated by ***P < 0.001, **P < 0.01 and *P < 0.05
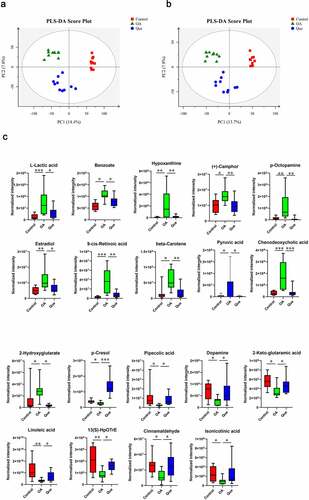
Figure 3. Continued
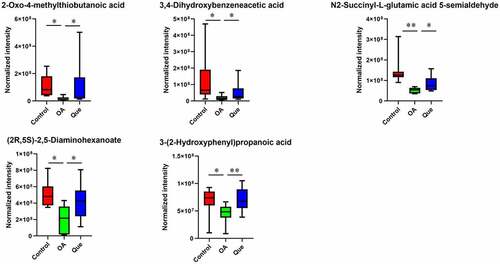
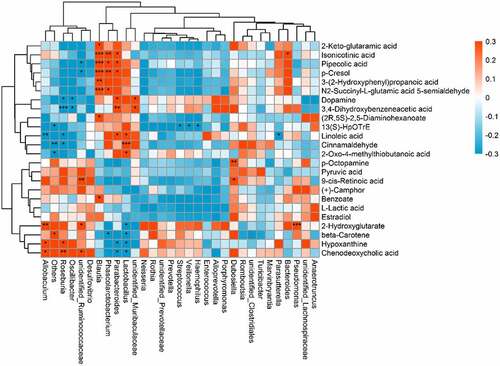
Figure 4. Relationship between the gut microbiome and host metabolome. Heat maps indicate positive (red) and negative (blue) correlations between the levels of host metabolites and the gut microbiome genera in quercetin-treated rats compared to OA rats. The legend shows correlation values from −1 to 1 and the associated colors: red for positive correlations, and blue for negative correlations (* P < 0.05, ** P < 0.01, *** P < 0.001)