Figures & data
Figure 1. Effects of rhein on body weight and size of rat. The rats of different groups received the following treatment for six weeks, respectively. normal chow, high-fat diet (HFD) (D12492, 60% kcal%, research diets, USA), high-fat diet +Rhein-L (lose dose), high-fat diet (60% kcal%) + Rhein-M (medium dose), high-fat diet (60% kcal%) +Rhein-H (high dose). (a) Growth curve of mice in each group. (b) The body length after rhein administration for 6 weeks. (c) Lee’s index. n = 6 rats/group. HFD, high-fat diet-fed rats. **p < 0.01, ***p < 0.001 versus control. #p < 0.05, ##p < 0.01 versus HFD
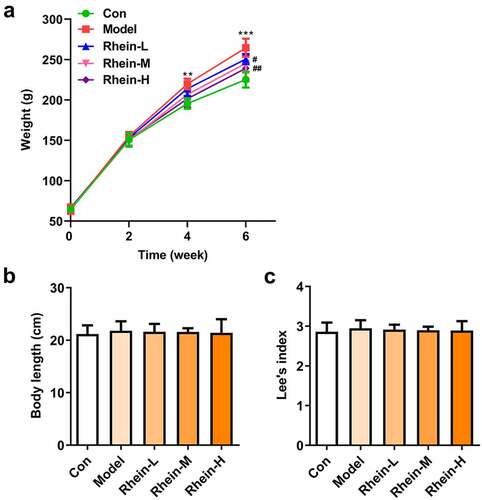
Figure 2. Effects of rhein on IR and blood lipid levels. The rats of different groups were fed by the following administration, respectively, for six weeks, respectively: normal chow, high-fat diet (HFD) (D12492, 60% kcal%, Research Diets, USA), high-fat diet +Rhein-L (lose dose), high-fat diet (60% kcal%) + Rhein-M (medium dose), high-fat diet (60% kcal%) +Rhein-H (high dose). (a) The blood glucose. (b) Insulin levels. (c) Insulin resistance levels. (d) Western blotting analysis of PPARγ and INSR. n = 6 rats/group. HFD, high-fat diet-fed rats. (e) The blood lipid levels. *p < 0.05, **p < 0.01, ***p < 0.001 versus control. #p < 0.05, ##p < 0.01, ###p < 0.001 versus HFD
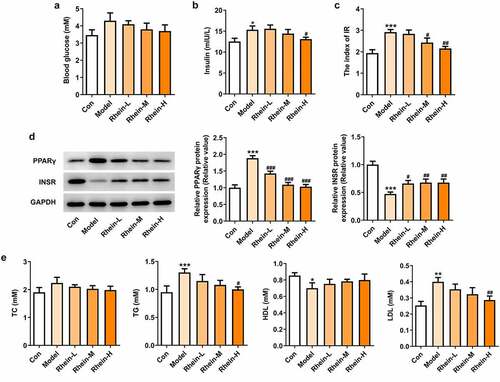
Figure 3. Effects of rhein on inflammation and oxidative stress. The rats of different groups were administrated through the following treatment for six weeks, respectively. normal chow, high-fat diet (HFD) (D12492, 60% kcal%, Research Diets, USA), high-fat diet +Rhein-L (lose dose), high-fat diet (60% kcal%) + Rhein-M (medium dose), high-fat diet (60% kcal%) +Rhein-H (high dose). (a) The detection of inflammatory markers levels. (b) Oxidative stress levels. n = 6 rats/group. HFD, high-fat diet-fed rats. ***p < 0.001 versus control. #p < 0.05, ##p < 0.01, ###p < 0.001 versus HFD
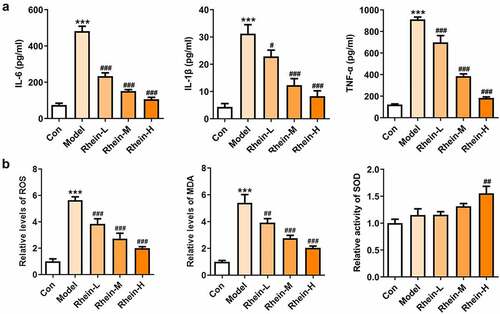
Figure 4. The effects of rhein on pathological changes of blood vessel were evaluated by HE staining. After the rats of different groups were fed by the following administration, respectively, for six weeks, respectively: normal chow, high-fat diet (HFD) (D12492, 60% kcal%, Research Diets, USA), high-fat diet +Rhein-L (lose dose), high-fat diet (60% kcal%) + Rhein-M (medium dose), high-fat diet (60% kcal%) +Rhein-H (high dose), blood vessel tissue was collected
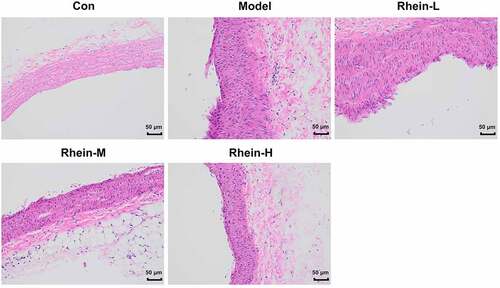
Figure 5. Rhein suppressed cell apoptosis of vascular tissues. The rats of different groups received the following treatment for six weeks, respectively. normal chow, high-fat diet (HFD) (D12492, 60% kcal%, Research Diets, USA), high-fat diet +Rhein-L (lose dose), high-fat diet (60% kcal%) + Rhein-M (medium dose), high-fat diet (60% kcal%) +Rhein-H (high dose). (a) Tunel analysis of vascular tissues. (b) Western blotting analysis of caspase12 and 3. n = 6 rats/group. HFD, high-fat diet-fed rats. ***p < 0.001 versus control. ##p < 0.01, ###p < 0.001 versus HFD
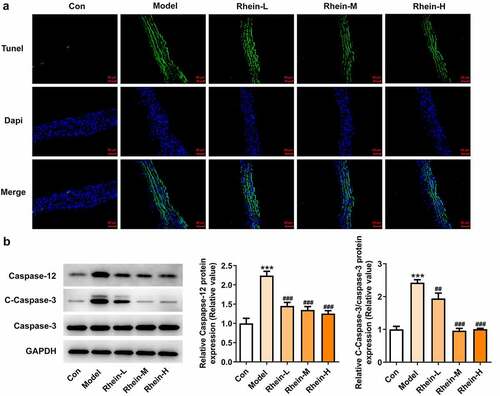
Figure 6. Rhein lowed the expression levels of ERs-related proteins and ATG5 levels. n = 6 rats/group. The rats of different groups received the following treatment for six weeks, respectively. normal chow, high-fat diet (HFD) (D12492, 60% kcal%, Research Diets, USA), high-fat diet +Rhein-L (lose dose), high-fat diet (60% kcal%) + Rhein-M (medium dose), high-fat diet (60% kcal%) +Rhein-H (high dose). HFD, high-fat diet-fed rats. ***p < 0.001 versus control. #p < 0.05, ##p < 0.01, ###p < 0.001 versus HFD
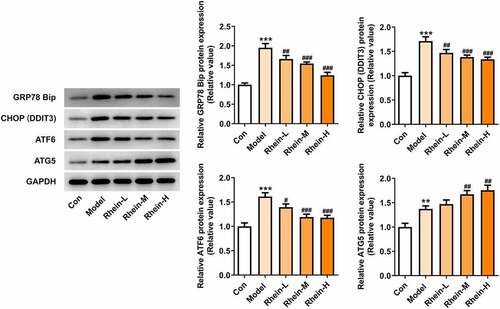
Figure 7. Effects of rhein on the expression levels of PPARγ and INSR through Western blotting analysis. n = 6 rats/group. The rats of different groups received the following treatment for six weeks, respectively. normal chow, high-fat diet (HFD) (D12492, 60% kcal%, Research Diets, USA), high-fat diet +Rhein-L (lose dose), high-fat diet (60% kcal%) + Rhein-M (medium dose), high-fat diet (60% kcal%) +Rhein-H (high dose). HFD, high-fat diet-fed rats. ***p < 0.001 versus control. ###p < 0.001 versus HFD
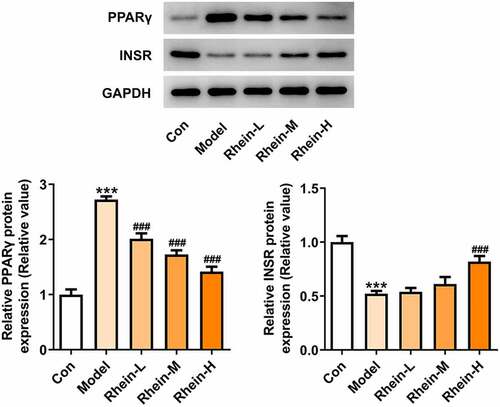
Figure 8. Effects of rhein on inflammation and oxidative stress in adipose tissue. The rats of different groups received the following treatment for six weeks, respectively. normal chow, high-fat diet (HFD) (D12492, 60% kcal%, Research Diets, USA), high-fat diet +Rhein-L (lose dose), high-fat diet (60% kcal%) + Rhein-M (medium dose), high-fat diet (60% kcal%) +Rhein-H (high dose). (a) The analysis of inflammatory markers levels. (b) Oxidative stress levels. n = 6 rats/group. HFD, high-fat diet-fed rats. ***p < 0.001 versus control. #p < 0.05, ##p < 0.01, ###p < 0.001 versus HFD
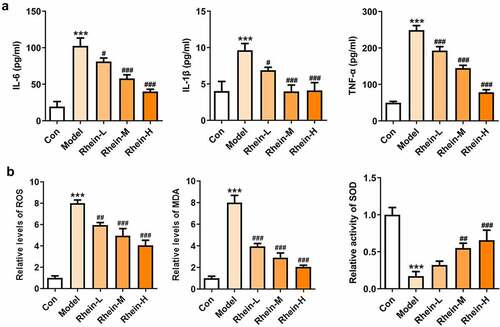
Figure 9. Effects of rhein on apoptosis and ER stress of adipose tissue in SD rats fed with HFD. The rats of different groups received the following treatment for six weeks, respectively. normal chow, high-fat diet (HFD) (D12492, 60% kcal%, Research Diets, USA), high-fat diet +Rhein-L (lose dose), high-fat diet (60% kcal%) + Rhein-M (medium dose), high-fat diet (60% kcal%) +Rhein-H (high dose). (a). Tunel staining for adipose tissue. (b). western blot analysis of adipose tissue showing the expression of caspase12, caspase3 and cleaved caspase3. n = 6 rats/group. HFD, high-fat diet-fed rats. ***p < 0.05 versus control. #p < 0.05, ##p < 0.01, ###p < 0.001 versus HFD
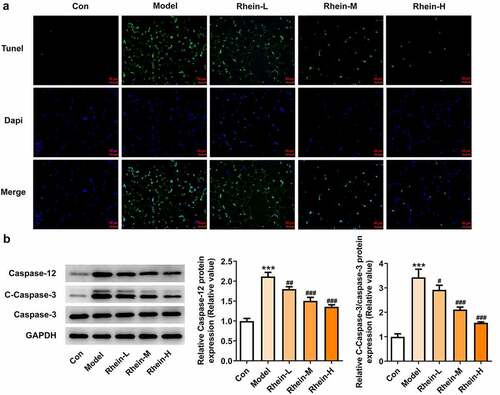
Figure 10. Effects of rhein on ER stress of adipose tissue in SD rats fed with HFD. western blot analysis of adipose tissue showing the expression of ERs-related protein and ATG5. The rats of different groups received the following treatment for six weeks, respectively. normal chow, high-fat diet (HFD) (D12492, 60% kcal%, Research Diets, USA), high-fat diet +Rhein-L (lose dose), high-fat diet (60% kcal%) + Rhein-M (medium dose), high-fat diet (60% kcal%) +Rhein-H (high dose). n = 6 rats/group. HFD, high-fat diet-fed rats. ***p < 0.05 versus control. ##p < 0.01, ###p < 0.001 versus HFD
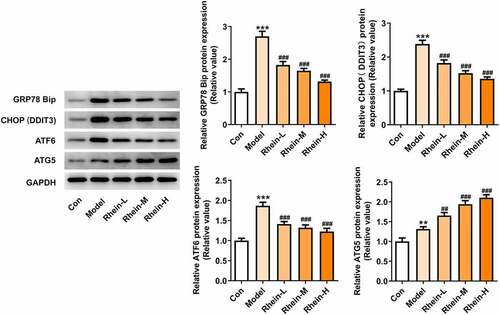
Figure 11. Rhein treatment decreased lipid formation and apoptosis of 3T3-L1 induced by inflammatory factors. The supernatant culturing Raw246.7 cells with LPS stimulation was collected and used to incubate with 3T3-L1 preadipocytes. (a). The levels of inflammatory factors, IL-6, IL-1β and TNF-α, in LPS-induced Raw246.7 macrophages. (b). Quantitative analysis of lipid droplet accumulation. (c, d). Detection of cell apoptosis by flow cytometry in 3T3-L1 cells. (e). Representative images of caspase12, caspase3 and cleaved caspase3 expression by Western blot. Statistical analysis was performed using one-way ANOVA followed by Tukey’s multiple comparison test. Each experiment was repeated at least three times. ***p < 0.001 versus control, #p < 0.05, ##p < 0.01, ###p < 0.001 versus Model
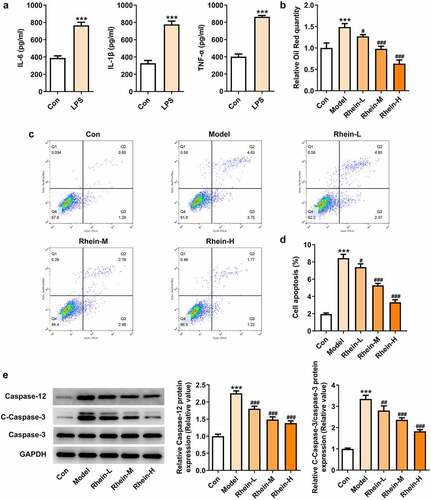
Figure 12. Rhein treatment affected PPARγ and INSR protein levels, and inflammation. The supernatant culturing Raw246.7 cells with LPS stimulation was collected and used to incubate with 3T3-L1 preadipocytes. (a). The expression of PPARγ and INSR. (b). The quantitative analysis of inflammatory factor IL-6, IL-1β and TNF-α. Each experiment was repeated at least three times. ***p < 0.001 versus control. #p < 0.05, ##p < 0.01, ###p < 0.001 versus Model
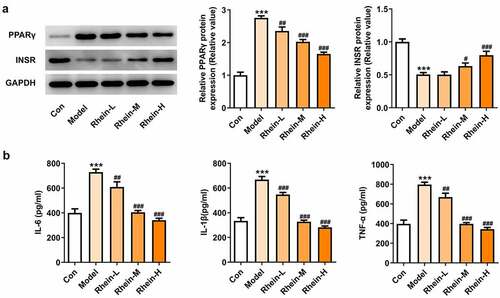
Figure 13. Rhein treatment affected ERs and autophagy of 3T3-L1 cells with inflammatory stimulation. Representative images and quantification of ERs-related proteins and autophagy-related protein in 3T3-L1 cells with inflammatory supernatant induction. The supernatant culturing Raw246.7 cells with LPS stimulation was collected and used to incubate with 3T3-L1 preadipocytes. Each experiment was repeated at least three times. ***p < 0.001 versus control. #p < 0.05, ##p < 0.01, ###p < 0.001 versus Model
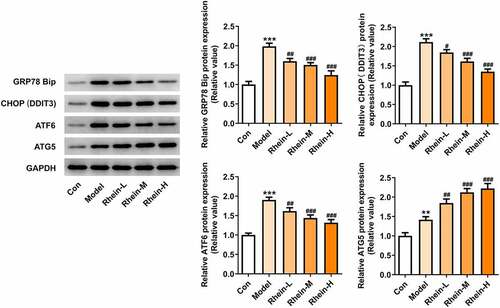
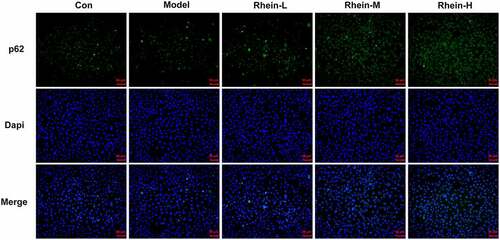
Figure 14. Rhein treatment increased p62 protein levels. Representative images of p62 immunoreactivity (green) in 3T3-L1 cells. The supernatant culturing Raw246.7 cells with LPS stimulation was collected and used to incubate with 3T3-L1 preadipocytes. This experiment was repeated four times. **p < 0.01, ***p < 0.001 versus control. #p < 0.05, ##p < 0.01, ###p < 0.001 versus Model