
Figures & data
Figure 1. Expression and prognostic value of miR-26b-5p in TSCC. (a) the level of miR-26b-5p in TSCC tissues in TCGA dataset compared with normal tongue tissues. (b) comparison of miR-26b-5p expression in 8 paired samples collected from the TSCC patients. (c) kaplan-meier plots for overall survival (OS) in TCGA-HNSC patients, grouped by low and high expression of miR-26b-5p. P values were obtained using log-rank test
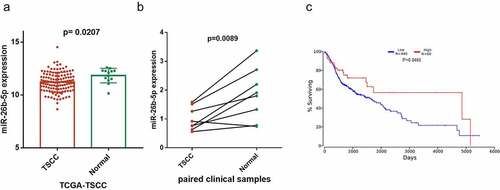
Figure 2. Effect of miR-26b-5p on cell cycle progression in CAL27 cells. (a) effects of miR-26b-5p mimics and inhibitor on miR-26b-5p expression in CAL27 cells. (b) the viability of each group of cells was detected by CCK-8 assay. (c) for each group, cell cycle distribution was detected by flow cytometry analysis. (d) EdU staining (red) was performed to check the proliferating cells. cell nucleus were stained with DAPI (blue). (e) levels of PRR11, cyclinD1, and p-RbSer807 were detected by western blotting analysis in each group, with β-actin as the reference protein. *, p < 0.05
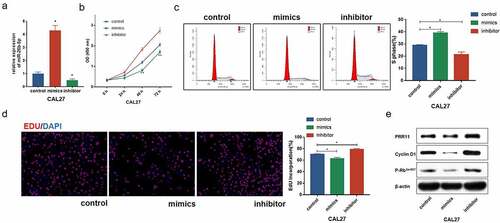
Figure 3. Expression and prognostic value of PRR11 in TSCC. (a) the level of PRR11 in TSCC tissues in TCGA dataset compared with normal tongue tissues. (b) comparison of PRR11 expression in 8 paired samples collected from TSCC patients. (c) kaplan-meier plots for overall survival (OS) in TCGA-HNSC patients, grouped by low and high expression of PRR11. P values were obtained using log-rank test
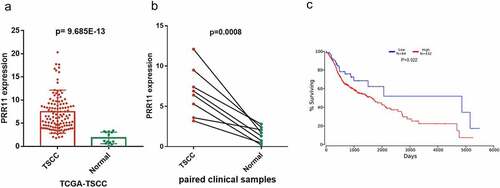
Figure 4. Correlation of miR-26b-5p and PRR11 expression in TSCC. pearson correlation analysis shows a negative correlation between miR-26b-5p and PRR11 mRNA level in the (a) TCGA-TSCC subset (n = 110) and (b) 8 paired samples
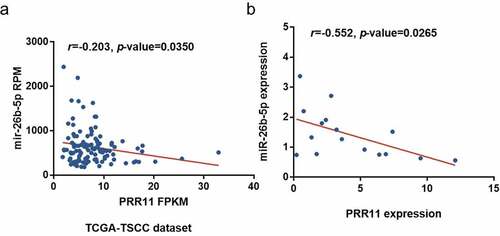
Figure 5. miR-26b-5p repressed PRR11 by binding to the 3ʹ-UTR of PRR11. (a) effects of miR-26b-5p on the luciferase activity of the reporter gene inserted downstream of the wildtype and mutated PRR11 3ʹ-UTR in CAL27 cells. the sequence of the miR-26b-5p binding site in the 3ʹUTR of PRR11 mRNA and its corresponding mutation were indicated. (b) RNA pulldown assay was performed in CAL27 cells transfected with wildtype and mutated PRR11, followed by qRT-PCR to detect the abundance of PRR11 and miR-26b-5p. data are presented as the mean ± standard deviation (SD). ns, not significant; *, p < 0.05
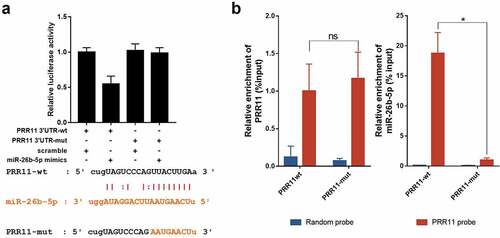
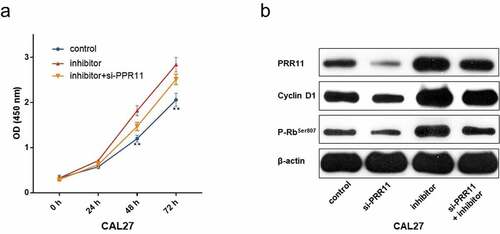
Figure 6. PRR11 knockdown attenuates the repression effects of miR-26b-5p on CAL27cell proliferation. (a) the viability of each group of cells was detected by CCK-8 assay. (b) western blot analysis of the impact of si-PRR11 on PRR11, cCyclinD1 and p-RbSer807 expression. data are presented as the mean ± SD
Availability of data and materials
The datasets analyzed in the current study are available from the TCGA (cancergenome.nih.gov) repository. TCGA allows researchers to download relevant data for research and publish relevant articles.