
Figures & data
Table 1. Sample information of datasets
Figure 1. Work flow chart
Figure 2. Screening of differentially expressed genes. (a) Volcano plot of differentially expressed genes in dataset GSE56116; (b) Heat map of differentially expressed genes
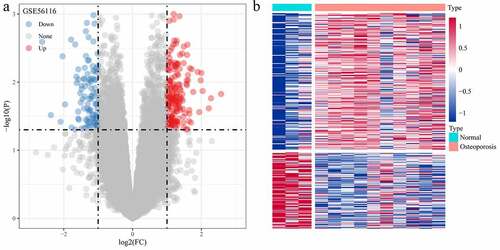
Figure 3. Functional enrichment of differentially expressed genes. (a) BP annotation of differentially expressed genes; (b) CC annotation of differentially expressed genes; (c) MF annotation of differentially expressed genes; (d) KEGG annotation of differentially expressed genes
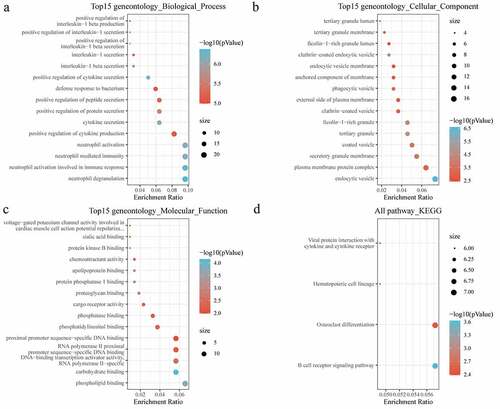
Figure 4. PPI analysis of the gene of the functional module
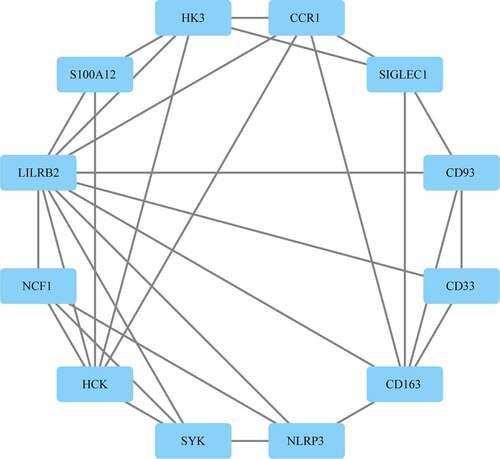
Figure 5. Functional enrichment of functional module genes. (a) BP annotation of functional module genes; (b) CC annotation of functional module genes; (c) MF annotation of functional module genes; (d) KEGG annotation of functional module genes
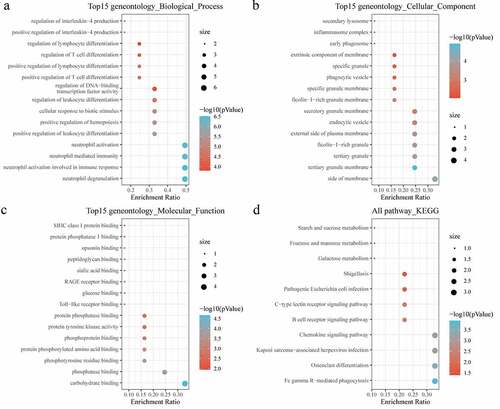
Figure 6. Identification of Hub genes. (a) PPI network diagram of hub genes obtained by Closeness algorithm. (b) PPI network diagram of hub genes obtained by MCC algorithm. (c) PPI network diagram of hub genes obtained by MNC algorithm. (d) PPI network of hub genes obtained by Degree algorithm
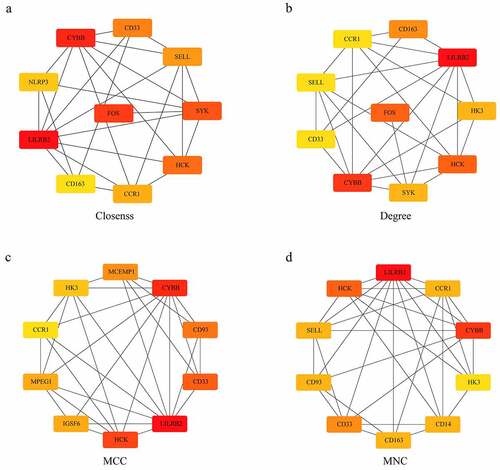
Figure 7. Venn diagram of hub genes identification
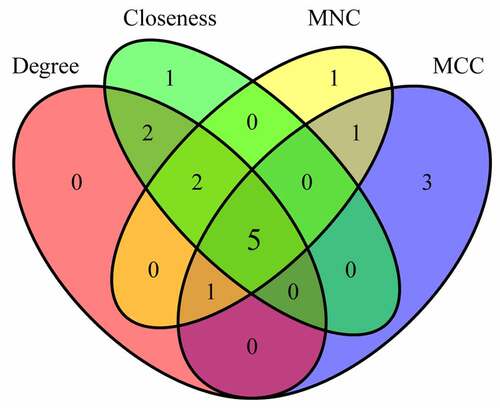
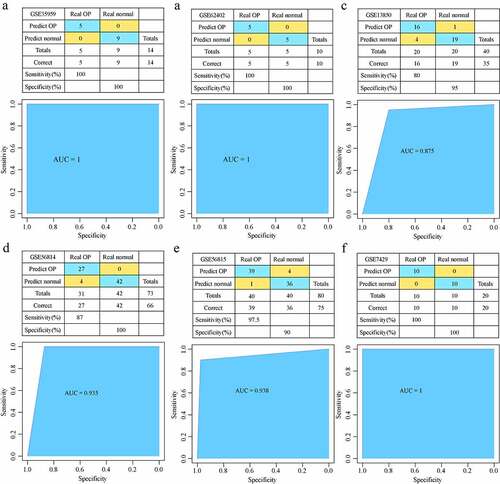
Figure 8. Development and verification of the model. (a) The classification result and ROC curve of the GSE35959 dataset sample by the diagnostic model; (b) The classification result and ROC curve of the GSE62402 dataset sample by the diagnostic model. (c) The classification result and ROC curve of the GSE13850 dataset sample by the diagnostic model; (d) The classification result and ROC curve of the GSE56814 dataset sample by the diagnostic model; € The classification result and ROC curve of the GSE56815 dataset sample by the diagnostic model; (f) The classification result and ROC curve of the GSE7429 dataset sample by the diagnostic model
Availability of data and materials
The data that support the findings of this study are openly available in GSE35959 [https://www.ncbi.nlm.nih.gov/geo/query/acc.cgi?acc=GSE35959], GSE62402 [https://www.ncbi.nlm.nih.gov/geo/query/acc.cgi], GSE13850 [https://www.ncbi.nlm.nih.gov/geo/query/acc.cgi], GSE56814 [https://www.ncbi.nlm.nih.gov/geo/query/acc.cgi], GSE56815 [https://www.ncbi.nlm.nih.gov/geo/query/acc.cgi], and GSE7429 [https://www.ncbi.nlm.nih.gov/geo/query/acc.cgi] datasets.