
Figures & data
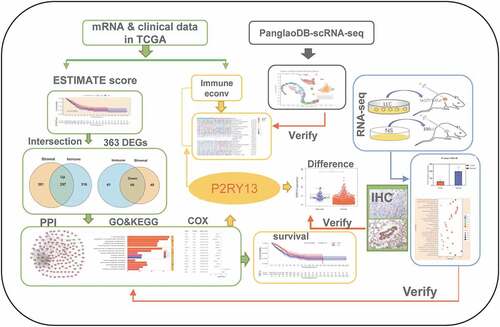
Figure 1. Correlation between TME scores and survival of patients with LUAD. (a) Kaplan–Meier survival curve for ImmuneScore with high or low score determined by the comparison with the median (P = 0.013 by log-rank test). (b) The survival curve for StromalScore with Kaplan–Meier method (P = 0.023 by log-rank test). (c) Kaplan–Meier survival curve for ESTIMATEScore (P = 0.020 by log-rank test). TME: Tumor microenvironment; LUAD: Lung adenocarcinoma
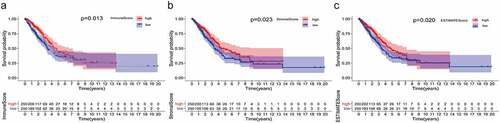
Figure 2. Venn plots, and enrichment analysis of GO and KEGG for DEGs based on ImmuneScore and StromalScore. (a-b) Venn plots showing the up-regulated and down-regulated DEGs shared by the ImmuneScore and StromalScore. (c-d) GO and KEGG enrichment analysis for 363 DEGs (barplot), terms with p and q < 0.05 were believed to be enriched significantly. (e-f) GO and KEGG enrichment analysis for 363 DEGs (circos). GO: Gene Ontology; KEGG: Kyoto Encyclopedia of Genes and Genomes; DEGs: differentially expressed genes
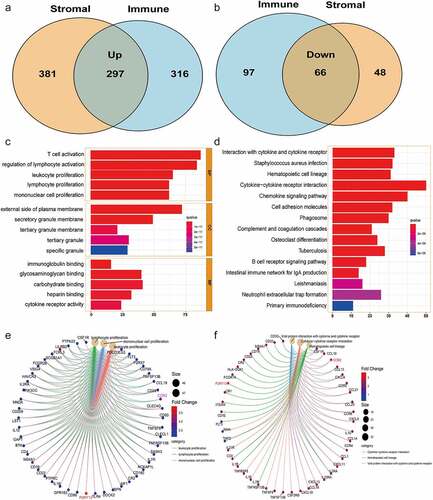
Table 1. Univariate and multivariate cox regression analysis based on LUAD clinicopathological features and P2RY13 gene
Figure 3. Screening of the key genes regulating TME based on the intersection analysis of PPI network and univariate Cox regression. (a) PPI network constructed with the minimum confidence intervals larger than 0.90. (b) The key modules were determined from PPI network by MCODE tool (the yellow modules represent the hub genes). (c) Univariate Cox regression analysis with 363 DEGs, listing the top 15 significant factors with p < 0.001. (d) Venn plot showing the prognostic-related core genes shared by leading 30 nodes from PPI and top 15 significant factors in univariate Cox. (e) Differential expression of CCR2 and P2RY13 in LUAD tumor and normal tissues. (f) Verification of expression of CCR2 and P2RY13 in LUAD tumor and normal tissues by THPA database. TME: Tumor microenvironment; LUAD: Lung adenocarcinoma; PPI network: protein protein interaction network
Figure 4. Analysis of correlation between P2RY13 and prognosis and clinicopathological features of patients with LUAD. (a) Kaplan–Meier survival curve for LUAD patients with different P2RY13 expression. (P = 0.002 by log-rank test). (b) The Kaplan-Meier online database was used to analyze the survival of 699 LUAD patients with high P2RY13 expression and 703 patients with low P2RY13 expression. (c) The Correlation between P2RY13 expression and clinicopathological characteristics of LUAD patients (*P < 0.05, **P < 0.01, and ***P < 0.001, with Kruskal–Wallis rank sum test). (d) Spearman’s correlation analysis was used to describe the correlation between P2RY13 gene expression and TMB(r = −0.16). LUAD: Lung adenocarcinoma; TMB: Tumor Mutational Burden
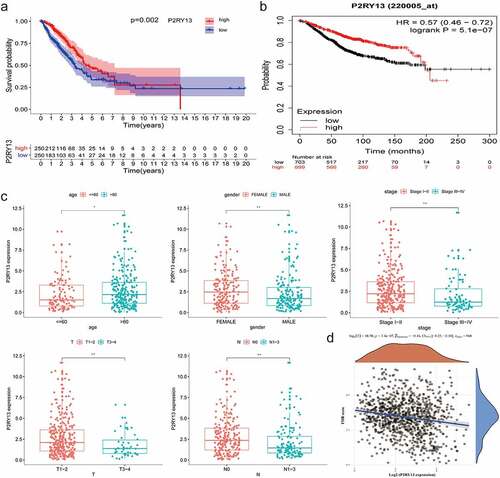
Figure 5. Analysis of RNA-seq results based on C57BL/6 tumor-bearing model and P2RY13 verification. (a) Hematic diagram of the RNA-seq process in this study. (b) Pearson correlation analysis based on gene expression in tumor-bearing model and control group. As shown in the figure, the correlation between tumor models and normal tissues was relatively lower, and the differences between groups based on gene expression were more obvious. (c) The histogram of gene expression distribution in tumor-bearing model group and control group, the gene expression gene of tumor group is lower than that of normal group. (d) Enrichment analysis (KEGG) bubble chart based on DEGs between the two groups. As shown in the figure, DEGs were significantly enriched in pathways related to the immune process. (e) Differential expression of P2RY13 gene in C57BL/6 lung cancer tissues and normal tissues, the expression of P2RY13 in tumor tissues was significantly reduced (P < 0.001). (f-g) Expression of P2RY13 protein in human LUAD and normal alveolar tissue (X200, SP). LUAD: Lung adenocarcinoma; KEGG: Kyoto Encyclopedia of Genes and Genomes; DEGs: differentially expressed genes
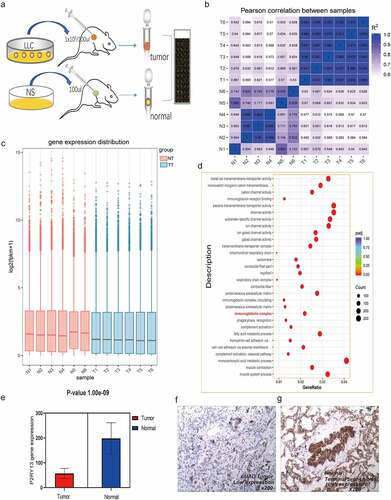
Table 2. Cluster analysis of P2RY13 gene-related cells in SRS2823408 sample based on scRNA-seq
Table 3. Cluster analysis of P2RY13 gene-related cells in SRS2823412 sample based on scRNA-seq
Figure 6. The expression profile of main TICs in LUAD tissues and the difference and correlation analysis with P2RY13 expression. (a) Barplot showing the proportion of main kinds of TICs in LUAD tumor samples. (b) Heatmap showing the correlation between the main TICs and numeric in each tiny box indicating the p value of correlation between two kinds of cells. (c) The violin plot showed the difference in the proportion of main TICs in the P2RY13 high expression and low expression groups. (d) Venn plot showed 13 kinds of TICs related to the expression of P2RY13 by correlation and difference analysis displayed in violin and scatter plots, respectively. (e) Analysis of the correlation between P2RY13 and 13 immune cells, which included eight TICs that were positively correlated with P2RY13 expression and five TICs that were negatively correlated with P2RY13 expression. TICs: tumor-infiltrating immune cells; LUAD: Lung adenocarcinoma
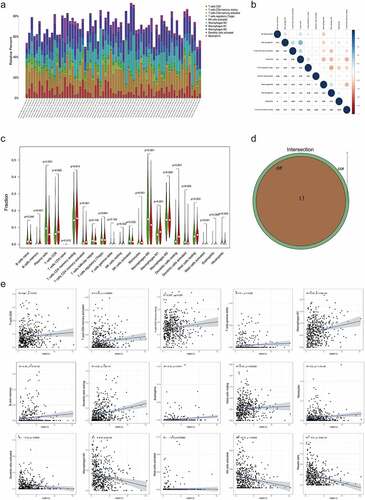
Figure 7. Six different calculation methods with R package were uesd to obtain the violin map and heat maps of P2RY13 gene expression. (a-f) The ‘immunedeconv’ R software package, which integrates six latest algorithms, including TIMER, xCell, MCP-counter, CIBERSORT, EPIC and quanTIseq, were used to verify the correlation between P2RY13 and immune cells in LUAD, P < 0.05 were selected as the screening condition (*P < 0.05, **P < 0.01, and ***P < 0.001). (g) The differential distribution of immune checkpoint-related genes in P2RY13 high expression and low expression groups, which were achieved by the R software packages ‘ggplot2’ and ‘pheatmap’. LUAD: Lung adenocarcinoma
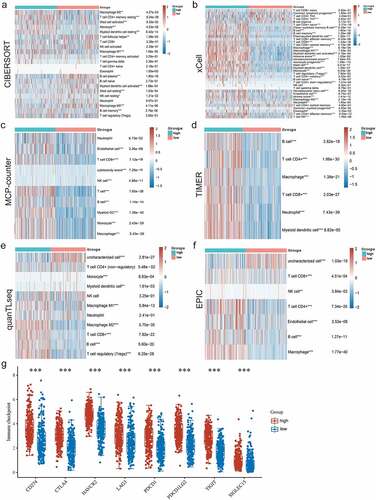
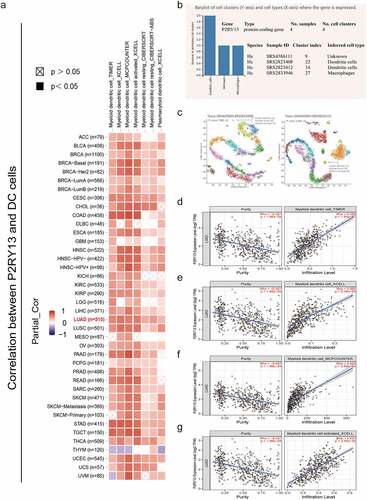
Figure 8. Correlation analysis between P2RY13 expression and immune cell infiltration in pan-cancer tumor tissues. (a) Correlation analysis between P2RY13 gene expression and DC infiltration in pan-carcinoma based on different algorithms. (b) Screening of immune cells significantly related to P2RY13 gene expression in PanglaoDB online database based on scRNA-seq, among which DCs were the most significant. (c) Use cluster analysis to visualize the location and number of DC cells in the panorama. (d-g) Correlation analysis between DC and P2RY13 gene expression in LUAD (r > 0.5). DCs: Dendritic cells; LUAD: Lung adenocarcinoma
Supplemental Material
Download ()Availability of data and materials
Please refer to the raw RNA-seq data of C57BL/6 mouse Lewis tumor-bearing model that we uploaded to BioSample database through the following link: https://www.ncbi.nlm.nih.gov/sra/PRJNA752479. For additional raw data, please contact the corresponding author for more information.