Figures & data
Figure 1. Circ0005654 is elevated in GC tissues and cells, which predicts a dismal survival. A, prediction of circ0005654 location, length, and host gene by circBase and UCSC websites; B, expression of circ0005654 in GC and adjacent tissues by RT-qPCR (*p < 0.05 by the paired t test); C, evaluation of the diagnostic effect of circ0005654 by a ROC curve using the Wilson/Brown analysis); D, survival analysis of patients with high or low expression of circ0005654 using the Kaplan-Meier analysis); E, circ0005654 expression in GC cells and GES-1 cells by RT-qPCR (*p < 0.05, **p < 0.01 by one-way ANOVA); F, the cellular localization of circ0005654 in MKN-45 and HGC-27 cells determined by FISH. Values are displayed as the mean ± SD on the basis of three independent experiments
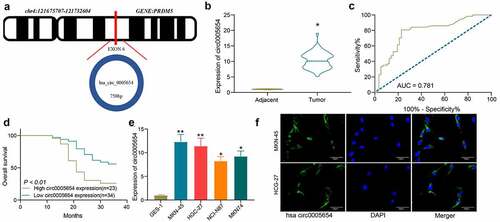
Figure 2. Circ0005654 suppresses the proliferation and aggressiveness of GC cells. A, circ0005654 expression after circ0005654 knockdown measured by RT-qPCR; B, OD values of cells after inhibition of circ0005654 assessed by CCK8; C, cell migration activity after inhibition of circ0005654 examined by Transwell assay; D, cell invasion activity after inhibition of circ0005654 examined by Transwell assay; E, cell apoptosis after inhibition of circ0005654 evaluated by Hoechst staining. Values are shown as the mean ± SD based on three independent experiments. *p < 0.05 vs cells transfected with NC. Experimental results were analyzed using two-way ANOVA followed by Tukey’s test
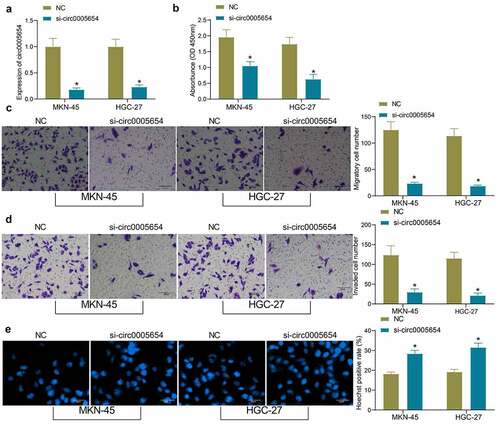
Figure 3. Circ0005654 functions as a miR-363 sponge to regulate sp1 in GC cells. A, expression of possible targeting miRNA of circ0005654 in GC cells examined by RT-qPCR; B, schematic representation of binding sites of miR-363 with circ0005654-WT or circ0005654-MT; C, miR-363 expression in GC cells and GES-1 cells by assessed by RT-qPCR; D, schematic illustration of the target mRNAs of miR-363 predicted by StarBase, Targetscan and miRanda; E, schematic representation of potential binding sites of miR-363 with sp1-WT or sp1-MT; F, the expression of miR-363 mimic in cells examined by RT-qPCR; G, sp1 expression in cells with poor expression of circ0005654 or high expression of miR-363. Values are shown as the mean ± SD based on three independent experiments. *#p < 0.05, **p < 0.01. Experimental results were analyzed using one-way (panel C) or two-way (panel A, B, E, F and G) ANOVA followed by Tukey’s test
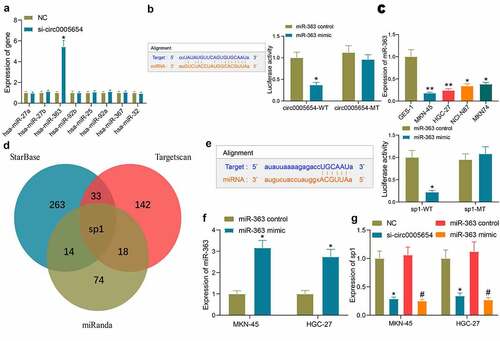
Figure 4. miR-363 and sp1 serve as diagnostic biomarkers in GC. A, miR-363 expression between GC and adjacent tissues assessed by RT-qPCR (*p < 0.05 by the paired t test); B, Person’s correlation analysis of circ0005654 and miR-363 expression in GC tissues; C, the diagnostic effect of miR-363 evaluated by ROC curves using the Wilson/Brown analysis; D, the survival curves of patients with poor or high expression of miR-363 using the Kaplan-Meier analysis; E, sp1 expression in GC and adjacent tissues assessed by RT-qPCR (*p < 0.05 by the paired t test); F, Person’s correlation analysis of circ0005654 and sp1 expression in GC tissues; G, Person’s correlation analysis of correlation between miR-363 and sp1; H, the predictive effect of sp1 on GC tissues evaluated by ROC curve using the Wilson/Brown analysis; I, the survival curves of patients with poor or high expression of sp1 using the Kaplan-Meier analysis
Figure 5. Circ0005654 or sp1 mitigates the effects of miR-363 on malignant phenotype in GC cells. A, circ0005654, sp1 and miR-363 expression after co-transfection measured by RT-qPCR; B, OD values of cells assessed by CCK8; C, cell migration activity examined by Transwell assay; D, cell invasion activity examined by Transwell assay; E, cell apoptosis evaluated by Hoechst staining. Values are shown as the mean ± SD based on three independent experiments. *p < 0.05 vs cells transfected with si-circ0005654 + miR-363 control; #p < 0.05 vs cells transfected with miR-363 control; @p < 0.05 vs cells transfected with miR-363 mimic + NC. Experimental results were analyzed using one-way (panel B, C, D, E) or two-way ANOVA (panel A) followed by Tukey’s test
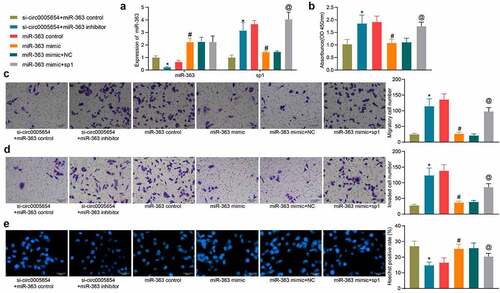
Figure 6. Circ0005654 or sp1 mitigates the effects of miR-363 on gastric carcinogenesis. A, circ0005654, sp1 and miR-363 expression in tissues using RT-qPCR to assess the efficiency of mouse model development; B-C, changes in the tumorigenic capacity of cells in xenograft models; D, HE staining for lung metastasis in mice after GC cell injection. *p < 0.05 vs mice injected with cells transfected with miR-363 control; #p < 0.05 vs mice injected with cells transfected with miR-363 mimic + NC. Experimental results were analyzed using one-way ANOVA followed by Tukey’s test
Figure 7. Sp1 binds to myc, thereby mediating the Wnt/β-catenin pathway. A, prediction of downstream genes and transcriptional sites of sp1 by bioinformatics analysis; B, the binding relation between myc and sp1 verified by ChIP experiments (*p < 0.05 by the two way ANOVA); C, myc expression between GC and adjacent tissues examined using RT-qPCR (*p < 0.05 by the paired t test); D, Person’s correlation analysis of sp1 and myc expression in GC tissues; E, expression of myc in MKN-45 cells after transfection examined using RT-qPCR (*#p < 0.05 by the one way ANOVA); F, the protein expression of myc and β-catenin in MKN-45 cells examined using western blot (*#p < 0.05 according to the two way ANOVA); G, the protein expression of sp1, myc and β-catenin in MKN-45 cells after circ0005654 knockdown examined using western blot (*#p < 0.05 according to the two way ANOVA); H, the protein expression of myc and β-catenin in xenografted mouse tumor tissues examined using western blot (*#p < 0.05 according to the two way ANOVA)
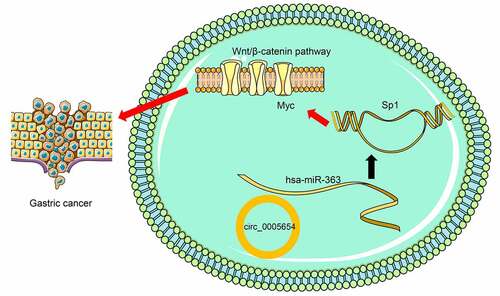
Figure 8. Summary of the regulation and mechanism in GC. circ0005654 positively regulated sp1 in GC by interacting with miR-363. sp1 activated the Wnt/β-catenin pathway by binding to myc