Figures & data
Figure 1. Screening essential GPCR-related genes for BLCA. (a) Through the integration of differential expression analysis, pathway analysis and survival analysis, we identified 12 essential GPCR-related genes that play an important role in BLCA. (b) The volcano plot was constructed based on differential expression analysis. The expression of RGS19 in BLCA was significantly upregulated (P = 4.2x10⁻¹³)
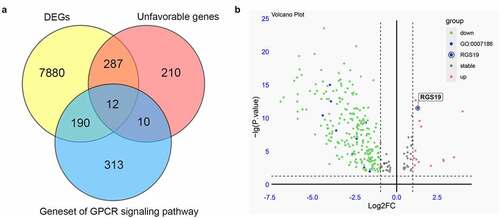
Figure 2. Overview of the expression levels of RGS19 between tumor and nontumor samples and summary of clinical analysis based on the TCGA. (a) The forest plot of the expression levels among 16 types of tumor, including breast invasive carcinoma (BRCA), colon adenocarcinoma (COAD), esophageal carcinoma (ESCA), head and neck squamous cell carcinoma (HNSC), kidney chromophobe carcinoma (KICH), kidney renal clear cell carcinoma (KIRC), kidney renal papillary cell carcinoma (KIRP), liver hepatocellular carcinoma (LIHC), lung adenocarcinoma (LUAD), lung squamous cell carcinoma (LUSC), prostate adenocarcinoma (PRAD), rectum adenocarcinoma (READ), stomach adenocarcinoma (STAD), thyroid carcinoma (THCA), and uterine corpus endometrial carcinoma (UCEC). (P < 0.01). (b) We analyzed the expression levels of RGS19 in 404 BLCA tumor samples and 28 nontumor samples. The box plot showed that RGS19 was highly expressed in BLCA tissue (P < 0.01). (c) The heatmap of the expression levels. (d) Overall survival analysis showed that the group of high-RGS19 patients had a worse prognosis (P = 0.041). (e) Disease-free survival analysis revealed that the survival time of high-RGS19 patients was shorter than that of low-RGS19 patients (P = 0.039)
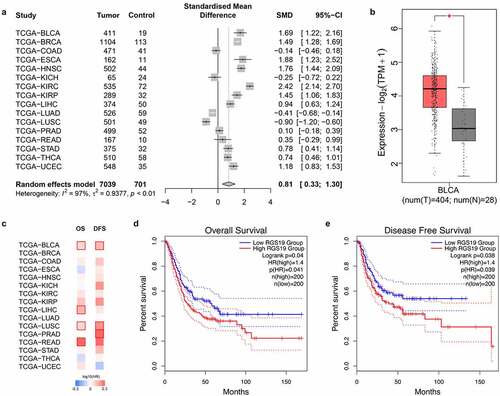
Figure 3. Colony formation experiments with shRGS19. (a) Compared to the background group, the knockout effect of RGS19 in 1,000 cell lines was significantly stronger. (b) The Western blot results of two constructed shRNA plasmids. shRGS19-1 showed a more significant effect on RGS19 silencing. (c and d). After the knockdown, the number of colonies was decreased significantly. The effect of shRGS19-1 was more potent
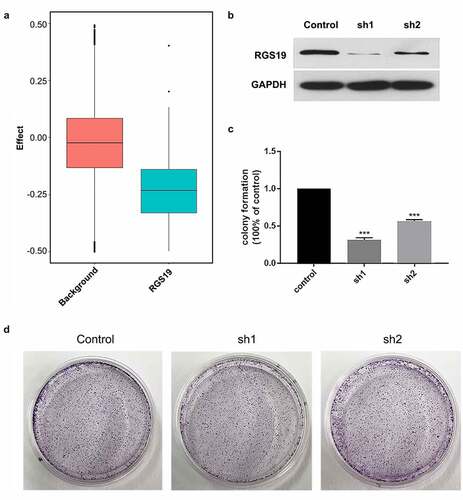
Figure 4. RGS19 regulated the cell cycle pathway. (a) GSEA of the transcriptome in BLCA tissue suggested that RGS19 is related to the activation of the cell cycle pathway. (b and c) According to the results of cell cycle analysis, shRGS19 caused cell cycle disorder with polyploids in T24 cells
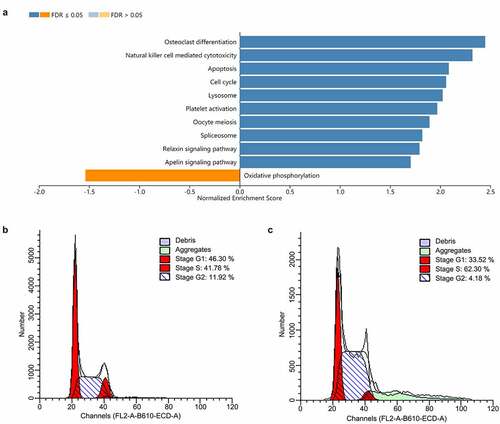
Figure 5. The expression of genes involved in the cell cycle pathway was associated with RGS19. (a) Genes involved in cell cycle pathway. (b) The results of qRT-PCR showed that sh-RGS19 caused the lower expression of 8 key genes in the cell cycle
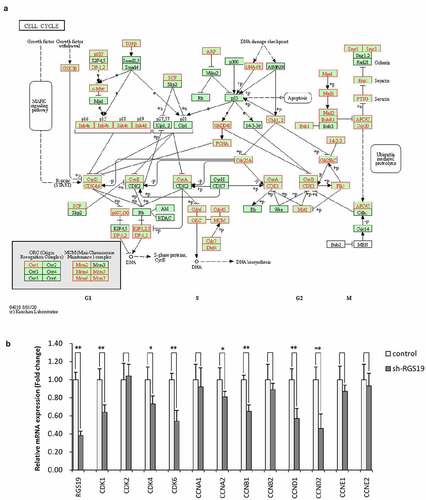
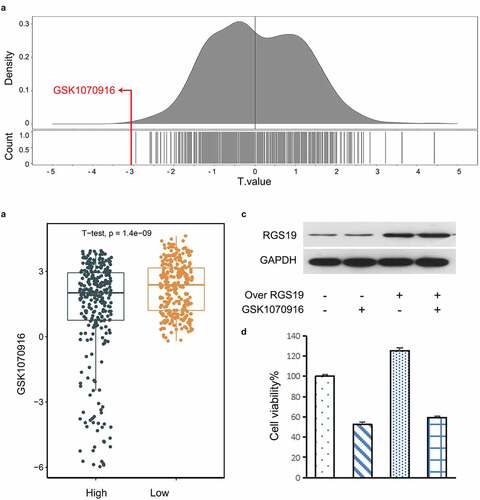
Figure 6. Drug screening for targeting RGS19. (a) In the GDSC database, we found that GSK1070916 was the most significant with the smallest t value. The negative t value indicated that overexpression of this gene was highly sensitive to this drug. (b) Targeted drug screening for RGS19 based on IC50. T24 cells were most sensitive to GSK1070916, with the smallest t value (P = 1.4 x 10⁻⁹). (c and d) The western blot and cell proliferation results of the inhibitory effect of GSK1070916 on RGS19 overexpression