Figures & data
Figure 1. Experimental process for the study of the EC pathway in patients with depression
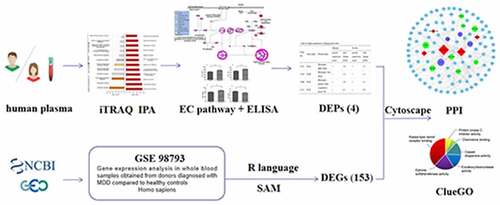
Table 1. Demographic and clinical characteristics of recruited subjects
Table 2. DEPs identified by iTRAQ and ELISA
Figure 2. EC pathway. The EC pathway was constructed based on IPA mapping. Green represents the down-regulated proteins, red represents the up-regulated proteins and pink circles indicate the complex formed during coagulation
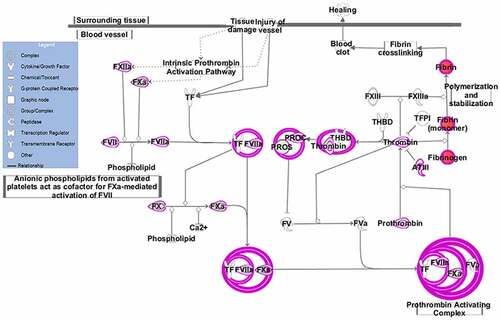
Figure 3. ELISA validation of DEPs in the EC pathway from depression patients (n = 20) and controls (n = 20). (a) FGA. (b) FGB. (c) FGG. (d) FVII. Data are expressed as mean ± s.e.m. p values were obtained by Student’s t-test statistical analysis. *p < 0.05, **p < 0.01, ***p < 0.001. Acronyms: FGA, fibrinogen alpha chain; FGB, fibrinogen beta chain; FGG, fibrinogen gamma chain; FVII, coagulation factor VII
Figure 4. PPI sub-network obtained by Cytoscape. Purple – DEPs in the EC pathway verified by ELISA; red – upregulated DEGs; green – downregulated DEGs; blue – other proteins; lines – relationships
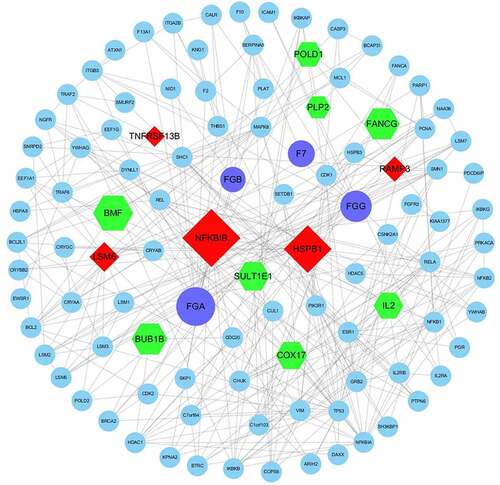
Table 3. The DEGs that interact with DEPs in the EC pathway. P-values are the average of two technical replicates calculated from the raw data
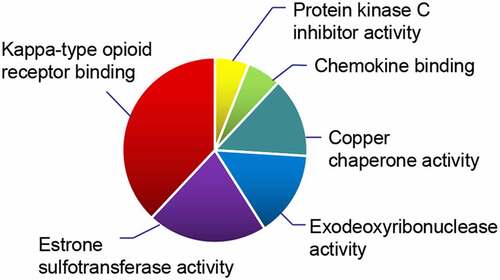
Figure 5. ClueGO results. Molecular function