Figures & data
Table 1. Clinicopathological characteristics of patients with hepatocellular carcinoma
Figure 1. FGD5-AS1 expression levels are upregulated in DDP-resistant HCC tissues and cells. (a) RT-qPCR was used to determine relative FGD5-AS1 expression in DDP-resistant HCC tissues (n = 32) and DDP-sensitive HCC tissues (n = 28). (b) RT-qPCR was used to analyze the expression of FGD5-AS1 in Huh7, Hep3B, Huh7/DDP and Hep3B/DDP cell lines. *P < 0.05
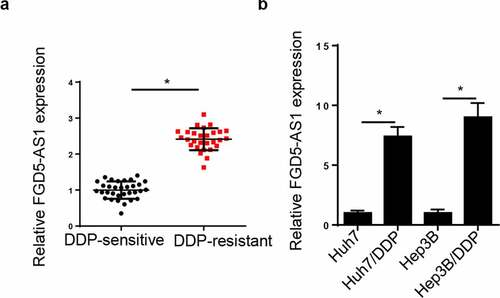
Figure 2. FGD5-AS1 knockdown suppresses DDP resistance in Huh7/DDP and Hep3B/DDP cells. (a) Reverse transcription-quantitative PCR analysis was used to determine relative FGD5-AS1 expression in Huh7/DDP and Hep3B/DDP cells transfected with shFGD5-AS1 or shNC. (b) CCK-8 assay was used to determine the IC50 value of Huh7/DDP and Hep3B/DDP cells transfected with shNC or shFGD5-AS1. (c-d) CCK-8, (e) colony formation and (f) Transwell assays were used to analyze Huh7/DDP and Hep3B/DDP cell proliferation and invasion, respectively, following the transfection with shFGD5-AS1 or shNC. (g) TUNEL assay was used to determine the apoptosis of Huh7/DDP and Hep3B/DDP cells transfected with shFGD5-AS1 or shNC. *P < 0.05
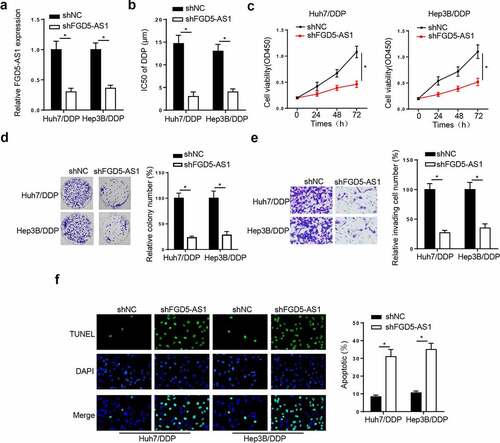
Figure 3. miR-153-3p is a target of FGD5-AS1 in DDP-resistant HCC cells. (a) StarBase database was used to predict the binding site between FGD5-AS1 and miR-153-3p. Dual luciferase reporter assay was used to determine the relative luciferase activity of FGD5-AS1-WT or FGD5-AS1-Mut vectors in (b) Huh7/DDP and (c) Hep3B/DDP cells co-transfected with NC mimic or miR-153-3p mimic. (d) RIP assay was used to measure the enrichment level of FGD5-AS1 in Huh7/DDP and Hep3B/DDP cells transfected with miR-153-3p mimic or NC mimic. (e) RT-qPCR was used to analyze the relative expression levels of miR-153-3p in DDP-resistant and -sensitive HCC cells. (f) RT-qPCR was used to determine relative miR-153-3p expression levels in Huh7/DDP and Hep3B/DDP cells transfected with shNC, shFGD5-AS1, pcDNA3.1 and pcDNA3.1/FGD5-AS1. *P < 0.05
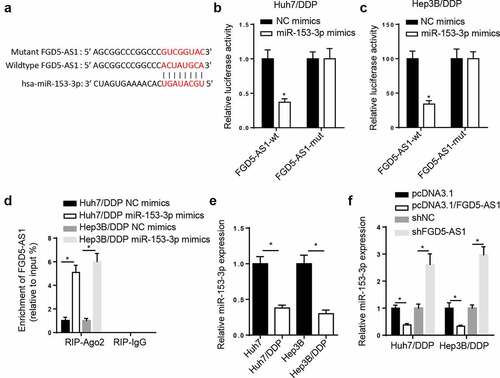
Figure 4. FGD5-AS1 regulates DDP resistance in DDP-resistant HCC cells by targeting miR-153-3p expression. (a) RT-qPCR was used to determine relative FGD5-AS1 expression in Huh7/DDP and Hep3B/DDP cells transfected with pcDNA3.1 or pcDNA3.1/FGD5-AS1. (b) RT-qPCR was used to analyze relative miR-153-3p expression in DDP-resistant HCC cells transfected with NC mimic, miR-153-3p mimic and miR-153-3p mimic + pcDNA3.1/FGD5-AS1. (c) CCK-8 assay was used to determine the IC50 value of DDP in Huh7/DDP and Hep3B/DDP cells transfected with NC mimic, miR-153-3p mimic and miR-153-3p mimic + pcDNA3.1/FGD5-AS1. (d and e) CCK-8, (f) colony formation, (g) Transwell and (h) TUNEL assays were used to analyze the proliferation, invasion and apoptosis, respectively, of Huh7/DDP and Hep3B/DDP cells transfected with NC mimic, miR-153-3p mimic and miR-153-3p mimic + pcDNA3.1/FGD5-AS1. *P < 0.05
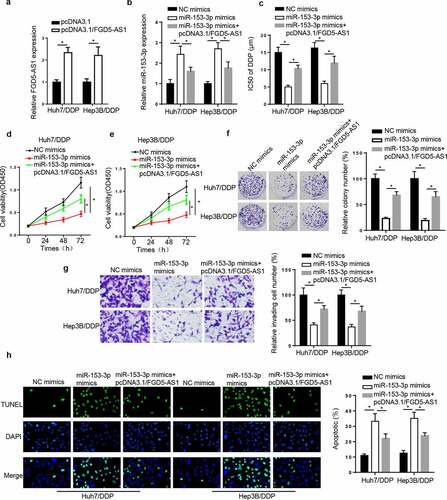
Figure 5. TWF1 is a target of miR-153-3p. (a) StarBase database was used to predict the binding site between TWF1 and miR-153-3p. Dual luciferase reporter assay was used to determine the relative luciferase activity of TWF1-WT or TWF1-Mut in (b) Huh7/DDP and (c) Hep3B/DDP cells co-transfected with NC mimic or miR-153-3p mimic. (d) RT-qPCR was used to analyze relative TWF1 expression in DDP-resistant HCC tissues (n = 32) and DDP-sensitive HCC tissues (n = 28). (e) RT-qPCR and (f) western blotting were used to determine the relative mRNA and protein expression of TWF1, respectively, in Huh7/DDP and Hep3B/DDP cells. (g) RT-qPCR and (h) western blotting were used to determine the relative mRNA and protein expression of TWF1 in Huh7/DDP and Hep3B/DDP cells transfected with NC mimic, miR-153-3p mimic, NC inhibitor and miR-153-3p inhibitor. *P < 0.05
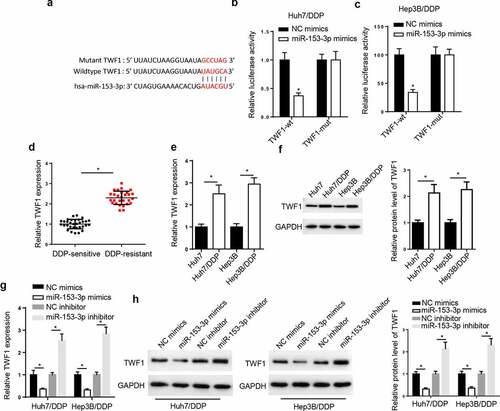
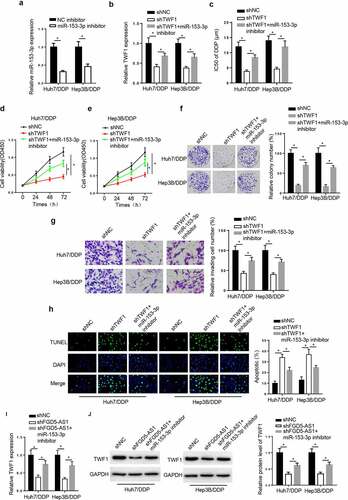
Figure 6. TWF1 knockdown decreases DDP resistance in DDP-resistant hepatocellular carcinoma cells by modulating miR-153-3p expression. (a) RT-qPCR was used to determine relative miR-153-3p expression in DDP-resistant cells transfected with NC inhibitor and miR-153-3p inhibitor. (b) RT-qPCR was used to determine relative TWF1 expression in Huh7/DDP and Hep3b/DDP cells transfected with shNC, shTWF1 or shTWF1 + miR-153-3p inhibitor. (c) CCK-8 assay was used to determine the IC50 value of DDP in DDP-resistant cells transfected with shNC, shTWF1 and shTWF1 + miR-153-3p inhibitor. (d and e) CCK-8, (f) colony formation and (g) Transwell assays were used to examine the proliferation and invasion, respectively, of Huh7/DDP and Hep3B/DDP cells transfected with shNC, shTWF1 and shTWF1 + miR-153-3p inhibitor. (h) TUNEL assays were used to assess the apoptosis of Huh7/DDP and Hep3B/DDP cells transfected with shNC, shTWF1 and shTWF1 + miR-153-3p inhibitor. (i) RT-qPCR and (j) western blotting were used to determine relative TWF1 expression in Huh7/DDP and Hep3B/DDP cells transfected with shNC, shFGD5-AS1 and shFGD5-AS1 + miR-153-3p inhibitor. *P < 0.05