
Figures & data
Figure 1. The culture of and the identification to bone marrow mesenchymal stem cells. (a) Bone marrow mesenchymal stem cells were cultured till their third generation. (b) Surface markers of BMSCs, CD45, CD90, were positive, while CD29,CD11b were negative. (c) Alizarin red staining was performed after four-week osteogenic differentiation. (d) Lipid droplets were observed by oil red O staining after 21d of adipogenic differentiation. (e) Isolated BMSCs colony was stained with crystal violet
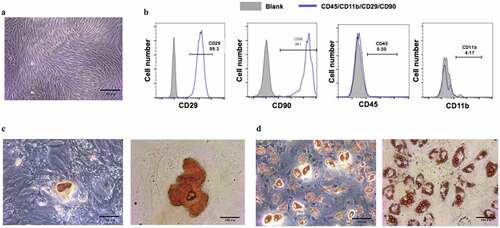
Figure 2. Optimal concentration of EMD and expression of mRNA. (a-b) The optimal concentration of EMD was 25 μg/ml. (c) The expression of osteogenesis-related genes was varying degrees higher when the concentration of EMD was 25 μg/ml. *P < 0.05, **P < 0.01 and ***P < 0.001 vs. the control
Figure 3. BMSCs’ cellular extracellular matrix mineralization subsequently the EMD stimulation. (a-b) The alizarin Red stained extracellular matrix mineralization of BMSCs after four-week EMD stimulation. The semi-quantitative measurments on the alizarin Red staining dye from the cultured cells within the period of BMSCs osteogenic differentiation after EMD stimulations was shown. (c) The number and the density of calcium nodules on the titanium surface were higher than those in the normal medium at the same time point. d. Protein level of Runx2 in BMSCs after three-day EMD treatment
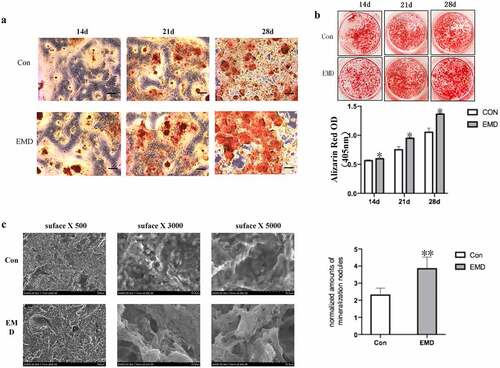
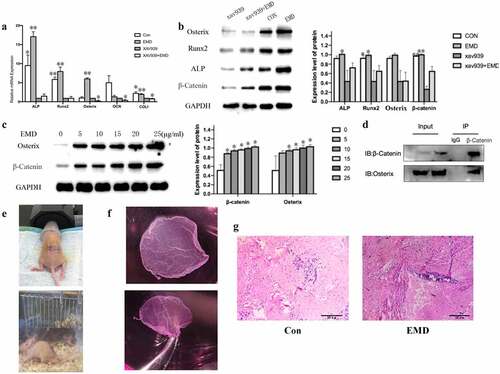
Figure 4. Wnt/β-catenin signaling’s relationship with EMD on bone marrow mesenchymal stem cells osteogenic differentiation and some vivo studies. (a-b) After adding inhibitors of Wnt classical pathway, the transcription factor β-catenin and the relative osteogenic gene expression decrease. *P < 0.05 and **P < 0.01 vs. the xav939 group. (c-d) Expression of Osterix was related with β – catenin. E-F 4 weeks after the cell sheets were implant in nude mice, there was not evident bone tissue formation in the control, but bone tissue formation was shown in the EMD treatment. *P < 0.05 and **P < 0.01 and ***P < 0.001 vs. 0 μg/ml EMD
Availability of data and materials
All data generated or analysed during this study are included in this published article