Figures & data
Figure 1. Preparation and characterization of resveratrol-loaded (Res-loaded) mesoporous silica nanoparticles (MSN)
A, Transmission electron microscopy (TEM) was used to detect the effect and sub-localization of MSNs and Res-loaded MSN to gastric cancer cells; Scale bar = 100 μm; B, Fourier transform infrared (FTIR) spectroscopy was used to detect the vibration peak of MSNs with different surface modification, including MSN, MSN-SH, MSN-SS-COOH, MSN/Res-COOH and MSN/Res-PEI-FA; C, UV spectrophotometry was used to detect the characteristic absorption peak of MSN with different surface modification, including MSN, MSN-SH, MSN-SS-COOH, MSN/Res-COOH and MSN/Res-PEI-FA.
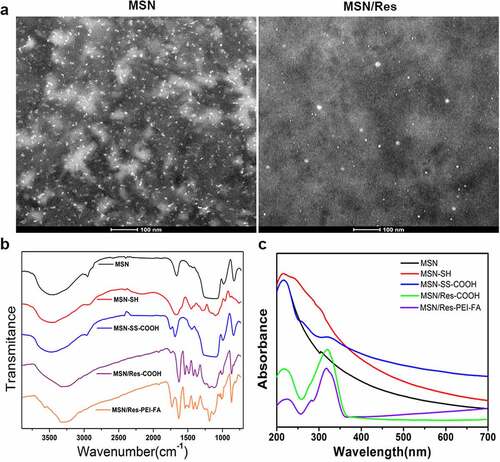
Figure 2. Cytotoxicity assay of Res-loaded MSN
A, Cell proliferation affected by MSN or Res-loaded MSNs with different concentrations from 0 to 400 μg/mL. Data shown as mean±SD. **P < 0.01, MSN/Res group Vs Control group; B, Hemolysis rate affected by MSN or Res-loaded MSNs with different concentrations from 0 to 400 μg/mL; C, Hematoxylin and eosin (H&E) staining was used to determine the presence of injury in the heart, liver, spleen, lung and kidney after MSN or Res-loaded MSN treatment. Magnification, 200× and 400 × .
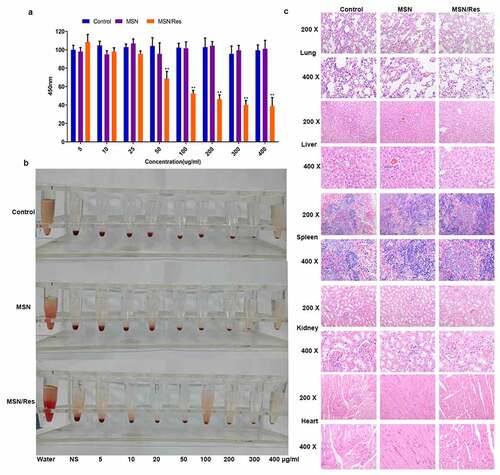
Figure 3. Res-loaded MSN showed better suppressive effect on HGC-27 and AGS cells than treatment with Res in vitro
A, CCK-8 analysis was used to detect the proliferation in both HGC-27 and AGS cells after treatment with Res, MSN-SH or Res-loaded MSN for 24, 48 and 72 h; B, HGC-27 and AGS cell proliferation after treatment with Res, MSN-SH or Res-loaded MSN was confirmed by EdU assay. Scale bar = 100 μm; C, Apoptosis after treatment with Res, MSN-SH or Res-loaded MSN was detected by terminal deoxynucleotidyl transferase biotin-dUTP nick end labeling (TUNEL). Scale Bar = 100 μm; D and E, Migration and invasion after Res, MSN-SH or Res-loaded MSN treatment was detected by Transwell analysis. Scale Bar = 100 μm; Data shown as mean±SD. **, P < 0.01, Res group Vs MSN-SH or Control group; ##, P < 0.01, MSN/Res group Vs Res group.
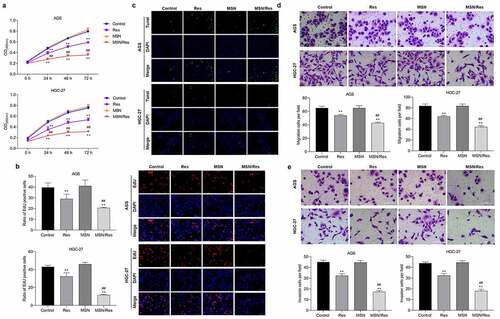
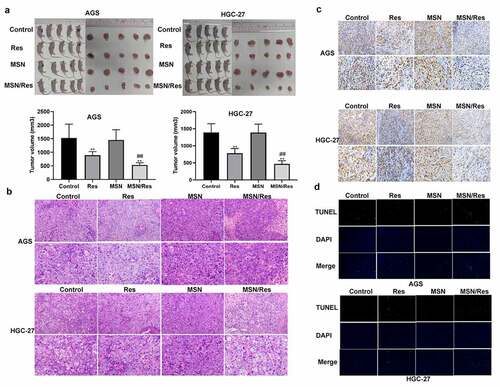
Figure 4. Res-loaded MSN showed better anticancer effect on gastric cancer than treatment with Res in vivo
A, Tumor size in tumor-bearing nude mouse model with HGC-27 and AGS cells treated with Res, MSN-SH, or Res-loaded MSNs; B, Inflammatory cell infiltration after treatment with Res, MSN-SH, or Res-loaded MSNs was detected by H&E staining. Magnification, 200× and 400×; C, The proliferation of HGC-27 and AGS cells in tumor-bearing nude mice was detected by Ki67 immunohistochemical staining. Magnification, 200× and 400×; D, Apoptotic HGC-27 and AGS cells treated with Res, MSH-SH, or Res-loaded MSN were detected by TUNEL. Scale bar = 100 μm; Data shown as mean±SD. **, P < 0.01, Res group Vs MSN-SH or Control group; ##, P < 0.01, MSN/Res group Vs Res group.