Figures & data
Table 1. Primers for qRT-PCR
Table 2. siRNA or inhibitor sequence used for transfection
Figure 1. SATB1-AS1 is upregulated in PBMC of AML patients. (a) Transcriptome analysis of 15 differentially expressed lncRNAs in PBMC from six healthy subjects and six AML patients. (b) the expression of SATB1-AS1 in PBMC from 26 healthy subjects and 43 AML patients measured by qRT-PCR. (c) SATB1-AS1 expression in AML in TCGA database predicted by a bioinformatics website GEPIA (http://gepia.cancer-pku.cn/index.html). (d) SATB1-AS1 expression in human bone marrow stromal cells HS-5 and AML cell lines measured by qRT-PCR. HL60/Adr and OCI-AML5/Cyt cells were exposed to different concentrations of Adr (0, 5 and 10 μM) and Cyt (0, 5, 10, 15, 20 and 25 μM). (e) The IC50 value of the cells determined by CellTiter-Glo assay. (f) The expression of SATB1-AS1 in parental and drug-resistant cells detected by qRT-PCR. The constructed SATB1-AS1 overexpression plasmid (empty vector as control) and the siRNAs targeting SATB1-AS1 (Scramble as control) were transfected into parental cells and drug-resistant cells, respectively. (g) The expression of SATB1-AS1 in parental and drug-resistant cells at the 48th h after transfection detected by qRT-PCR. Each assessment was fulfilled in triplicate with 3-time repetition to ensure minimum deviation; statistical data were measurement data, and described as mean ± standard deviation; Unpaired t test (panel b) or one-way (panels d, f and g) or two-way ANOVA (panel e) was applied to compare the differences between two groups or for multiple-group comparisons, followed by Tukey’s multiple comparisons test. * p < 0.05
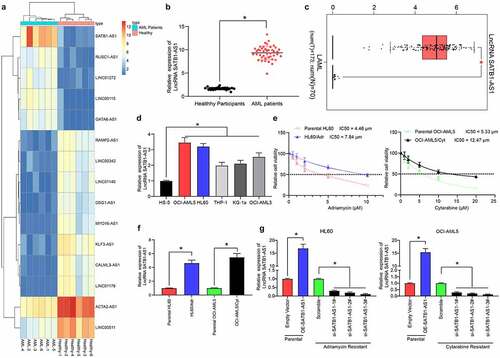
Figure 2. Downregulation of SATB1-AS1 mitigates the chemoresistance of AML cells in vitro. (a) The IC50 values of parental cells overexpressing SATB1-AS1 and of HL60/Adr and OCI-AML5/Cyt cells harboring silencing SATB1-AS1 measured by CellTiter-Glo assay. Adr (5 μM) was used to treat HL60 parental cells and resistant cells and 10 μM Cyt to treat OCI-AML5 parental cells and resistant cells, respectively. (b) Cell apoptosis tested by flow cytometry. (c) Hoechst 33,258 staining for cell apoptosis. (d) Cell proliferation evaluated by colony formation assay. (e) EdU staining for cell viability. (f) AML cell cytotoxicity evaluated by an LDH kit. Each assessment was done in triplicate with 3-time repetition to ensure minimum deviation; statistical data were measurement data, and described as mean ± standard deviation; one-way (panels b–f) or two-way ANOVA (panel a) was applied for multiple-group comparisons, followed by Tukey’s multiple comparisons test. * p < 0.05
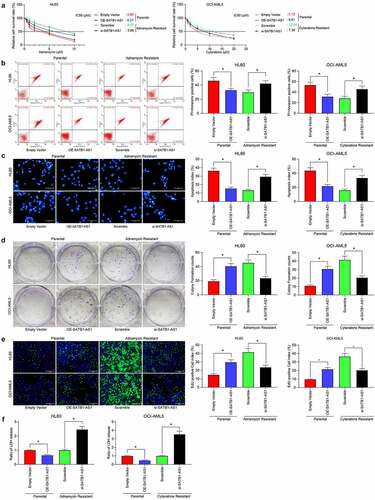
Figure 3. Downregulation of SATB1-AS1 mitigates the chemoresistance of AML cells in vivo. Each group of HL60 and OCI-AML5 parental cells and resistant cells were diluted with 2 mL normal saline (4 × 10⁶ cells) and injected under the armpit of nude mice. The tumor volume was measured every 6 d after the tumor volume grew to 50 mm3, and the mice were euthanized after 30 d with overdose of pentobarbital sodium (100 mg/kg). On the 6th and 24th d after the tumor volume measurement, the mice were injected with 5 mg/kg Adr and 10 mg/kg Cyt. (a) Volume of tumors in nude mouse. (b) Weight of tumors in nude mouse. (c) Immunohistochemical staining for the positive rate of KI67 in tumors. Statistical data were measurement data, and described as mean ± standard deviation (n = 6); one-way (panels b and c) or two-way ANOVA (panel a) was applied for multiple-group comparisons, followed by Tukey’s multiple comparisons test. * p < 0.05
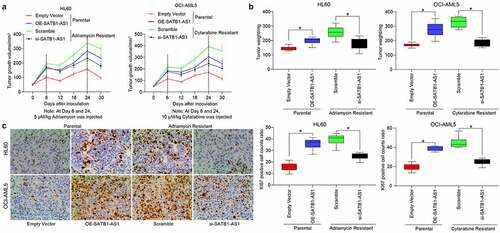
Figure 4. SATB1-AS1 promotes OAS2 expression by interacting with miR-580. (a) Transcriptome analysis of top 30 differentially expressed genes in HL60 cells overexpressing SATB1-AS1.; (b) The mRNA expression of OAS2 in PBMC from 26 healthy subjects and 43 AML patients measured by qRT-PCR. (c) OAS2 expression in AML in TCGA database predicted by a bioinformatics website GEPIA (http://gepia.cancer-pku.cn/index.html). (d) The correlation between SATB1-AS1 and OAS2 expression in AML patients analyzed by Pearson’s correlation test. (e) The subcellular localization of SATB1-AS1 predicted by LncAtlas (http://lncatlas.crg.eu/). (f) SATB1-AS1 subcellular localization in cytoplasm verified by FISH assay. (g) The relationship between SATB1-AS1, OAS2 and miR-580 was predicted by TargetScan and StarBase and verified by dual-luciferase reporter assays (h) The expression of miR-580 in PBMC from 26 healthy subjects and 43 AML patients measured by qRT-PCR. (i) The correlation between SATB1-AS1 and miR-580 expression in AML patients analyzed by Pearson’s correlation test. (j) The correlation between OAS2 and miR-580 expression in AML patients analyzed by Pearson’s correlation test. (k) The expression of OAS2 in HL60 and OCI-AML5 parental cells and drug-resistant cells assessed by qRT-PCR and immunoblotting. (l) The expression of OAS2 mRNA and miR-580 in HL60 and OCI-AML5 cells measured by qRT-PCR. (m) The protein expression of OAS2 in HL60 and OCI-AML5 cells measured by immunoblotting after overexpression or intervention of SATB1-AS1. Each assessment was done in triplicate with 3-time repetition to ensure minimum deviation; statistical data were measurement data, and described as mean ± standard deviation; unpaired t test (panels b and h) or two-way ANOVA (panels g, k–m) was applied to compare the differences between two groups or for multiple-group comparisons, followed by Tukey’s multiple comparisons test. * p < 0.05
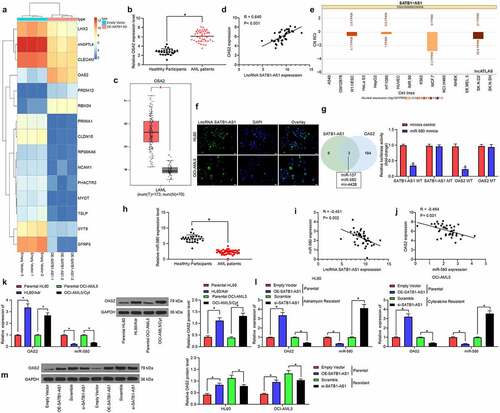
Figure 5. MiR-580 inhibition or OAS2 overexpression reverses the effects of SATB1-AS1 knockdown on AML cell chemoresistance. We transfected miR-580 inhibitor (Mock as a control) or OAS2 overexpression plasmid (Empty Vector as a control) in HL60/Adr cells and OCI-AML5/Cty in the presence of si-SATB1-AS1. (a) The expression of miR-580 and OAS2 in cells assayed by qRT-PCR. (b) The IC50 values of HL60/Adr and OCI-AML5/Cyt cells measured by CellTiter-Glo assay. Adr (5 μM) was used to treat HL60 parental cells and resistant cells and 10 μM Cyt to treat OCI-AML5 parental cells and resistant cells, respectively. (c) Cell apoptosis tested by flow cytometry. (d) Hoechst 33258 staining for cell apoptosis. (e) Cell proliferation determined by colony formation assay. (f) EdU staining for cell viability. Each assessment was done in triplicate with 3-time repetition to ensure minimum deviation; statistical data were measurement data, and described as mean ± standard deviation; one-way (panels a, c–f) or two-way ANOVA (panel b) was applied for multiple-group comparisons, followed by Tukey’s multiple comparisons test. * p < 0.05
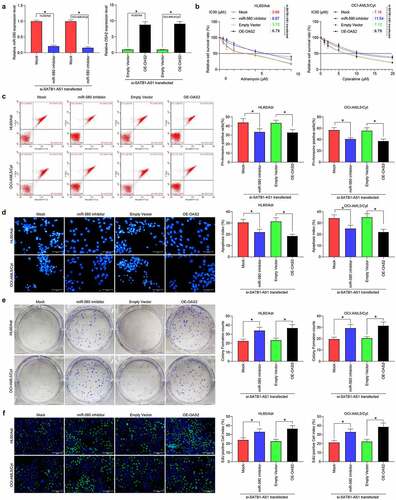
Figure 6. SATB1-AS1 knockdown stimulates the repressive role of GSK3β on β-catenin expression. (a) The expression of GSK3β and β-catenin in parental and drug-resistance cells detected by immunoblotting. (b) The expression of GSK3β and β-catenin in parental cells overexpressing SATB1-AS1 and drug-resistance cells with SATB1-AS1 knockdown detected by immunoblotting. (c) The expression of GSK3β and β-catenin in HL60/Adr cells and OCI-AML5/Cty cells transfected with miR-580 inhibitor or oe-OAS2 in the presence of SATB1-AS1 knockdown detected by immunoblotting. Each assessment was done in triplicate with 3-time repetition to ensure minimum deviation; statistical data were measurement data, and described as mean ± standard deviation; Two-way ANOVA was applied for multiple-group comparisons, followed by Tukey’s multiple comparisons test. * p < 0.05
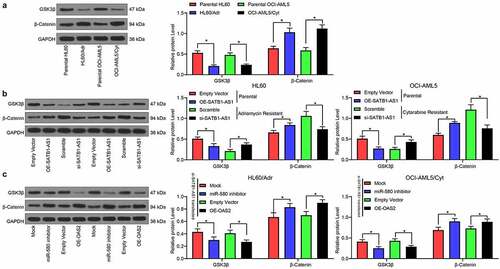
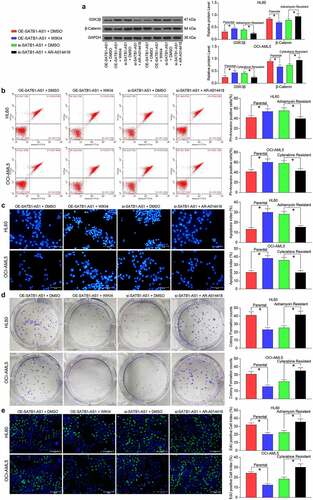
Figure 7. GSK3β inhibition attenuates the repressive effect of SATB1-AS1 knockdown on AML cell chemoresistance. A β-catenin specific inhibitor (WIKI4, 0.15 μM) or a GSK3β specific inhibitor (AR-A014418, 20 nM) was added to parental HL60 and OCI-AML5 cells overexpressing SATB1-AS1 or HL60/Adr cells and OCI-AML5/Cty cells with SATB1-AS1 knockdown, respectively. (a) The expression of GSK3β and β-catenin in parental and drug-resistance cells detected by immunoblotting. Adr (5 μM) was used to treat HL60 parental cells and resistant cells and 10 μM Cyt to treat OCI-AML5 parental cells and resistant cells, respectively. (b) Cell apoptosis evaluated by flow cytometry. (c) Hoechst 33258 staining for cell apoptosis. (d) Cell proliferation determined by colony formation assay. (e) EdU staining for cell viability. Each assessment was done in triplicate with 3-time repetition to ensure minimum deviation; statistical data were measurement data, and described as mean ± standard deviation; one-way (panels b–e) or two-way ANOVA (panel a) was applied for multiple-group comparisons, followed by Tukey’s multiple comparisons test. * p < 0.05