Figures & data
Figure 1. Aging-related phenotype, cell expansion, and cell cycle analysis of NK cells. (a-e) The human NK cells treated with calcitriol or rapamycin for 72 h showed the following cell biomarkers: natural killer group 2 member A (NKG2A), cluster of differentiation 16 (CD16), T cell immunoglobulin and mucin domain-containing protein 3 (TIM3) programmed cell death-1 (PD-1), and killer immunoglobulin-like receptor (KIR), which were related to aging. 50 nM rapamycin (RAPA) was used as the positive control. n = 3 for each group. *P < 0.05 and **P < 0.01 were compared with the negative control (NC) group. (f) NK cells (right) isolated from human peripheral blood mononuclear cells (PBMCs, left) by Magnetic bead sorting. (g) Cell proliferation analysis measured by cell counting kit 8 (CCK8). (h) Effect of calcitriol or rapamycin on the cell cycle in sorted NK cells after treatment for 72 h. *P < 0.05, ●P < 0.05, and #P < 0.05 indicated the significant differences in the G1, S, and G2 phases, respectively. All the groups were compared with NC, respectively. n = 3. (i) The percentage of T cell immunoglobulin and immunoreceptor tyrosine-based inhibitory motif (ITIM) domain (TIGIT)-positive NK cells after treatment with calcitriol or rapamycin for 72 h. *P < 0.05 and **P < 0.01 were compared with NC. n = 3
Figure 2. Effects of calcitriol on the functions of NK cells. (a) Analysis of the cytokine released by the calcitriol-treated NK cells in 48 h. (b) Fluorescence-activated cell sorting (FACS) results showed dead K562 cells labeled by 3,3′-dioctadecyl-oxacarbocyanine (DIO) and propidium iodide (PI). K562 cells were co-cultured with different ratios of calcitriol-treated NK cells for 4 h. (c) FACS analysis of dead K562 cells in NK-killing assays. (d) The degranulation effects of treated NK cells in killing assays. n = 3 for each group. *P < 0.05 and **P < 0.01 were compared with NC
Figure 3. The anti-aging effects of calcitriol on NK cells. (a) The expression of the vitamin D receptor (VDR), sirtuin 1 (SIRT1), SIRT1-∆Exon8, and protein kinase R-like endoplasmic reticulum kinase (pERK) in NK cells was detected by western blotting analysis after treatment with calcitriol for 48 h. Glyceraldehyde-3-phosphate dehydrogenase (GAPDH) was used as the loading control. Bar diagram illustrating the western blotting results (n = 3). *P < 0.05 and **P < 0.01 were compared with NC (n = 3). (b) Dosage mortality curve of NK cells after treatment with hydrogen peroxide (H2O2) for 24 h. (c) Percentage of TIM3 cells exhibiting high expression after treatment with 100 μM H2O2 for 24 h. (d) The senescence-associated β-galactosidase staining and analysis results. The senescent cells were stained in blue and indicated by red arrows. Scale bar, 50 μm. (e) NK cells were stained with Hoechst and Chloromethyl-X-Rosamine (CMXRos) to determine the cell location and mitochondrial membrane potential. The aging and apoptotic cells were Hoechst+ CMXRos− and indicated by white arrows. Scale bar, 50 μm. Statistical analysis showed relative fluorescence intensity. *P < 0.05 and **P < 0.01 were compared with H2O2 group in figures C, D, and E (n = 3)
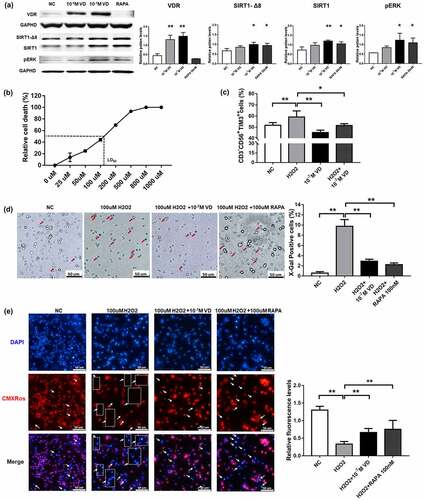
Figure 4. The anti-apoptotic effects of calcitriol on NK cells. (a) Anti-apoptotic effects of calcitriol in H2O2-induced injury. FACS analysis showed the percentage of apoptotic NK cells after treatment with 100 μM H2O2 for 24 h. (b) The expression levels of caspase-3 p20 and caspase-3 p17 in NK cells were detected by western blotting analysis after treatment with 100 μM H2O2 for 24 h. GAPDH was used as the loading control. Bar diagram illustrating the western blotting results (n = 3). *P < 0.05 was compared with the H2O2 group