
Figures & data
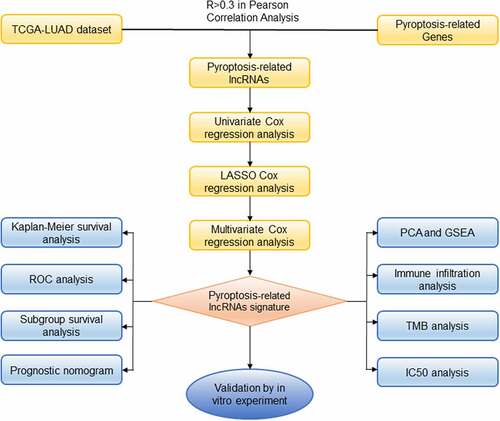
Figure 1. Infographic flowchart of the whole study
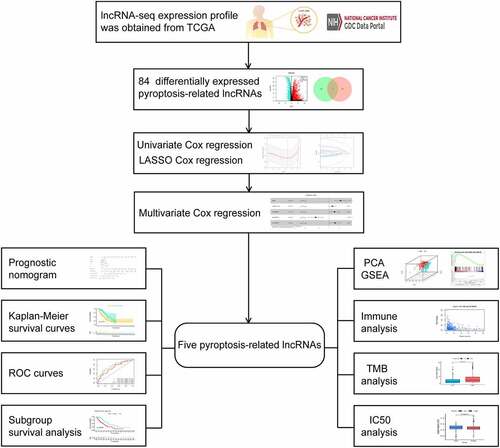
Figure 2. Construction of prognostic pyroptosis-related risk model composed of five lncRNAs. (a) Volcano plot presenting differentially expressed lncRNAs (DElncRNAs) discovered from LUAD tissues compared with non-carcinoma samples from TCGA dataset; (b) The Venn diagram of genes among DElncRNAs list and pyroptosis-related lncRNAs; (c-d) Lasso Cox regression analysis showing that 11 out of the 84 pyroptosis-related lncRNAs were good candidates for constructing the prognostic signature; (e) Forest plot presenting the HRs for the pyroptosis-associated prognosis model containing five lncRNAs
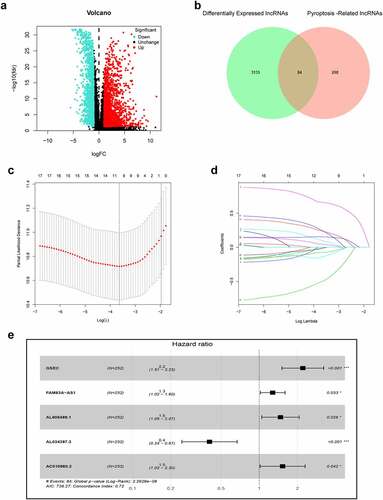
Table 1. Clinicopathologic characteristics of LUAD patients
Figure 3. Risk score of the pyroptosis-related signature for overall survival (OS). (a) Distribution of survival and (b) risk scores of high- and low-risk patients; (c) Kaplan-Meier survival curve analysis suggests that the notable difference in OS between low-risk and high-risk score group; (d) ROC analysis for verifying model performance in the prediction of LUAD survival rates at 1, 3 and 5 years in the training cohort, validation cohort and entire cohort
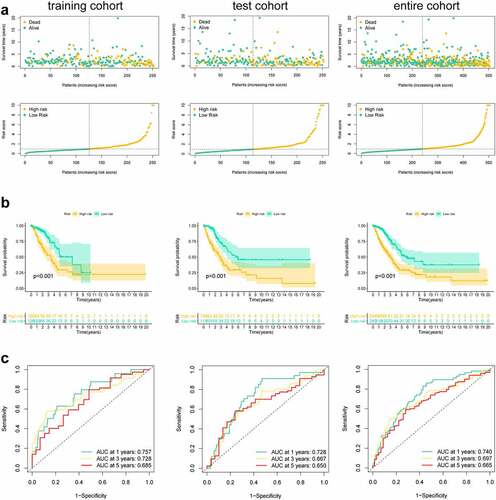
Figure 4. Subgroup survival analysis of OS for LUAD patients. (a) Age ≤ 65; (b) Age > 65; (c) Female; (d) Male; (e) Stage I–II; (f) Stage III–IV; (g) With radiotherapy history; (h) Without radiotherapy history
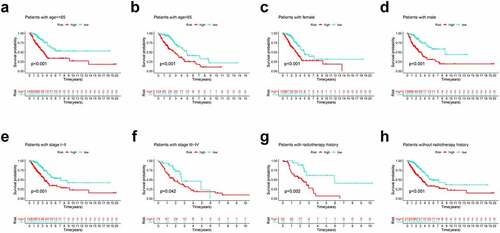
Figure 5. Combination of pyroptosis-related lncRNAs (PRlncRNAs) and clinical characteristics in predicting LUAD prognosis. (a) Univariate and (b) multivariate Cox regression methods for independent prognostic analysis of risk model; (c) Nomogram constructed to predict OS rates at 1, 3 and 5 years; (d-f) The nomogram calibration curves on consistency between predicted and observed 1‐, 3‐, and 5-year survival
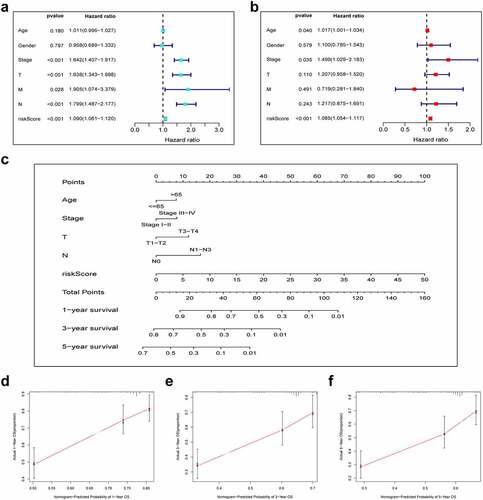
Figure 6. The low-risk and high-risk groups exhibited different distribution statuses and gene-set enrichment analysis (GSEA). (a) Principal components analysis (PCA) of risk groups based on the pyroptosis-associated gene sets; (b) GSEA on glycolysis; (c) GSEA on mTORC1 pathway; (d) GSEA on DNA repair; (e) GSEA on oxidative phosphorylation; (f) GSEA on PI3K/AKT/mTOR pathway; (g) GSEA on hypoxia
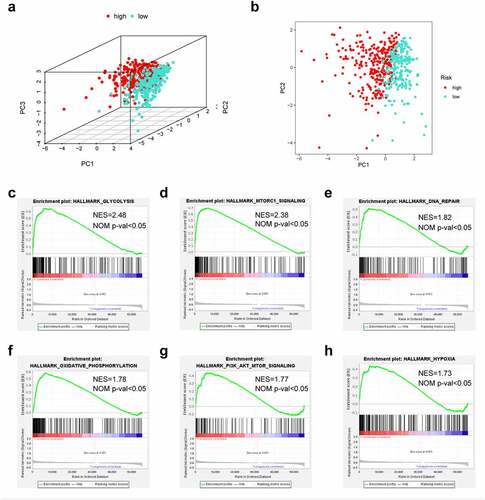
Figure 7. Association of risk scores with diverse immune cells and tumor mutation burden (TMB). (a) B cells (cor = −0.187); (b) CD4 + T cells (cor = −0.171); (c) CD8 + T cells (cor = −0.017); (d) Dendritic cells (cor = −0.169); (e) Macrophages (cor = −0.130); (f) Neutrophil (cor = −0.071); (g) The TMB of LUAD cases of in the high-risk and low-risk groups. Cor means the correlation value of risk scores with each immune cells
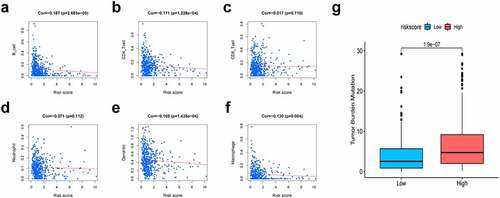
Figure 8. The prognosis signature used as an indicator for chemosensitivity as high-risk scores were related to half inhibitory centration (IC50) for chemotherapeutics. (a) cisplatin; (b) docetaxel; (c) doxorubicin; (d) gemcitabine; (e) paclitaxel
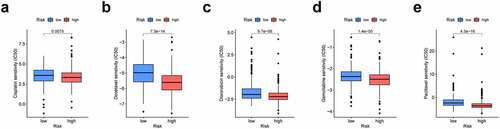
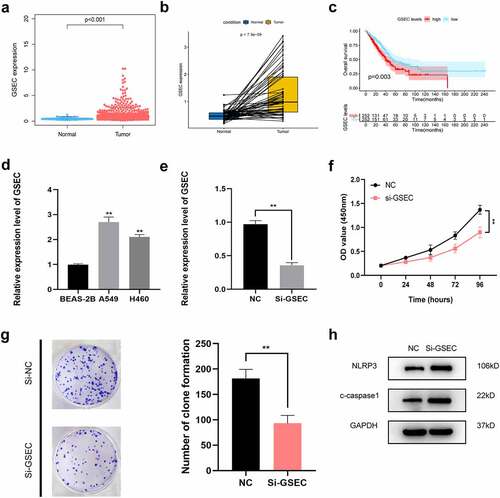
Figure 9. Effects of inhibiting the expression of GSEC on LUAD cell proliferation and pyroptosis. (a) Differential expression of GSEC between cancer and non-carcinoma samples; (b) Paired differentiation analysis on GSEC expression between cancer and non-carcinoma samples collected in one patient; (c) Kaplan-Meier survival analysis for LUAD patients with different GSEC expression; (d) GSEC expression increased within H460 and A549 cells relative to BEAS-2B; (e) GSEC was downregulated in A549 using siRNAs; (f-g) The proliferation of A549 cells transfected with siRNA against GSEC were measured using CCK8 assays and colony formation assays; (h) Western Blot was carried out to examine NLRP3 and cleaved caspase-1 (*p < 0.05; **p < 0.01; ***p < 0.001)
Supplemental Material
Download ()Data availability
Publicly available datasets were analyzed in this study. These data can be found here: TCGA (https://portal.gdc.cancer.gov/).